


Top meme coins Shiba Inu and PEPE rally as crypto market maintains bullish momentum
- Meme coins Shiba Inu and PEPE have seen double-digit gains in the past 24 hours.
- SHIB could rally to $0.0000299 if it validates a rounded bottom move.
- PEPE could rally to tackle its all-time high of $0.0000280 after overcoming a key trendline resistance.
Top meme coins Shiba Inu (SHIB) and PEPE rallied above 10% on Friday as the crypto market looked strong heading into the weekend. A massive surge in open interest in both tokens indicates rising investors's optimism.
PEPE and SHIB mark gains following open interest surge
Meme coins SHIB and PEPE are among the top gainers in the crypto market on Friday, each rallying above 10% in the past 24 hours.
SHIB sustained a 10% gain in the past week, with its trading volume hitting $1 billion for the first time since December 22. The surge in trading volume indicates rising investor activity on centralized exchanges.
Coinglass data reveals that SHIB saw a surge in exchange net inflows, which increased to nearly $20 million in the past 24 hours. The rise in inflows suggests investors may be looking to book profits with the recent market recovery.
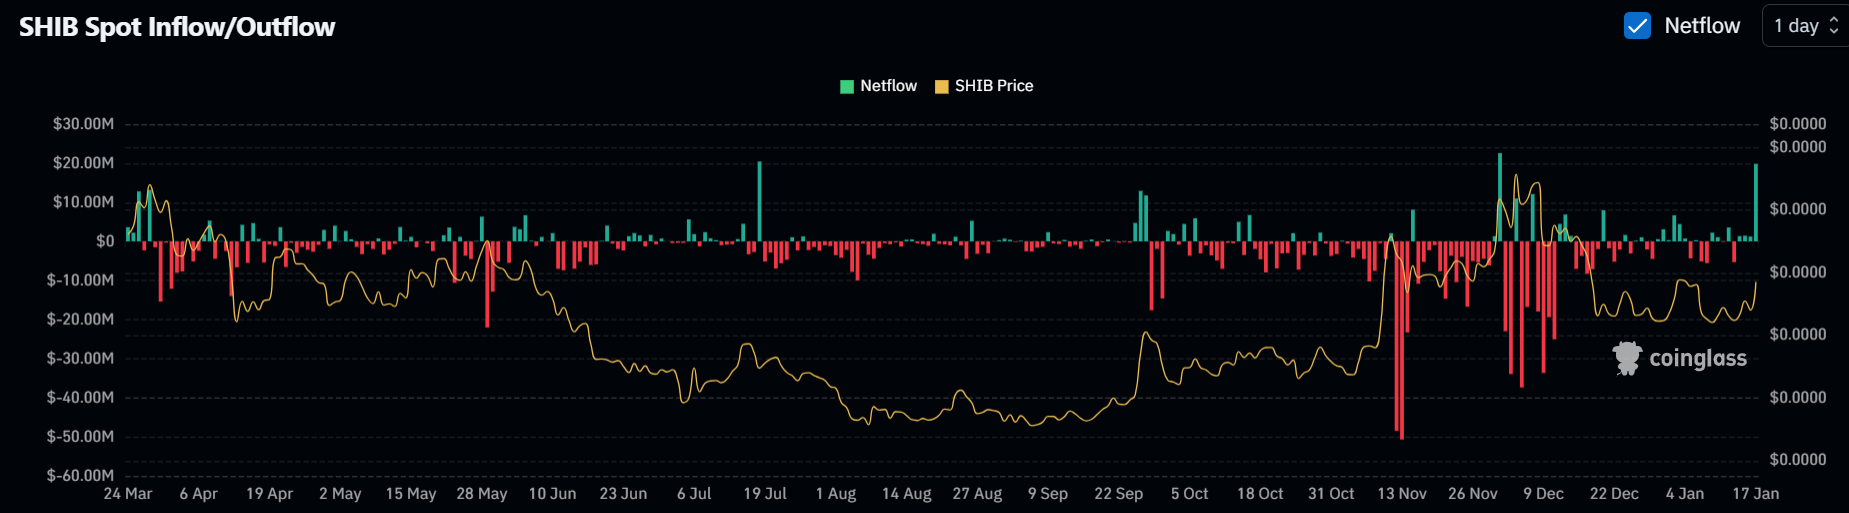
SHIB Exchange Netflows. Source: Coinglass
However, SHIB's open interest remains at elevated levels, rising from 3 trillion SHIB on January 1 to over 22 trillion SHIB at press time — a more than 600% increase. This indicates heightened optimism and potential for increased volatility.
On the daily chart, SHIB is attempting to validate a rounded bottom pattern but faces resistance at the $0.0000249 level. This resistance is strengthened by the 50-day Simple Moving Average (SMA).
A high volume move above $0.0000249 and establishing it as a support level could see SHIB rally to $0.0000299 — just below the $0.0000300 psychological level. The target is obtained by measuring the pattern's height and projecting it upward from the potential breakout point.
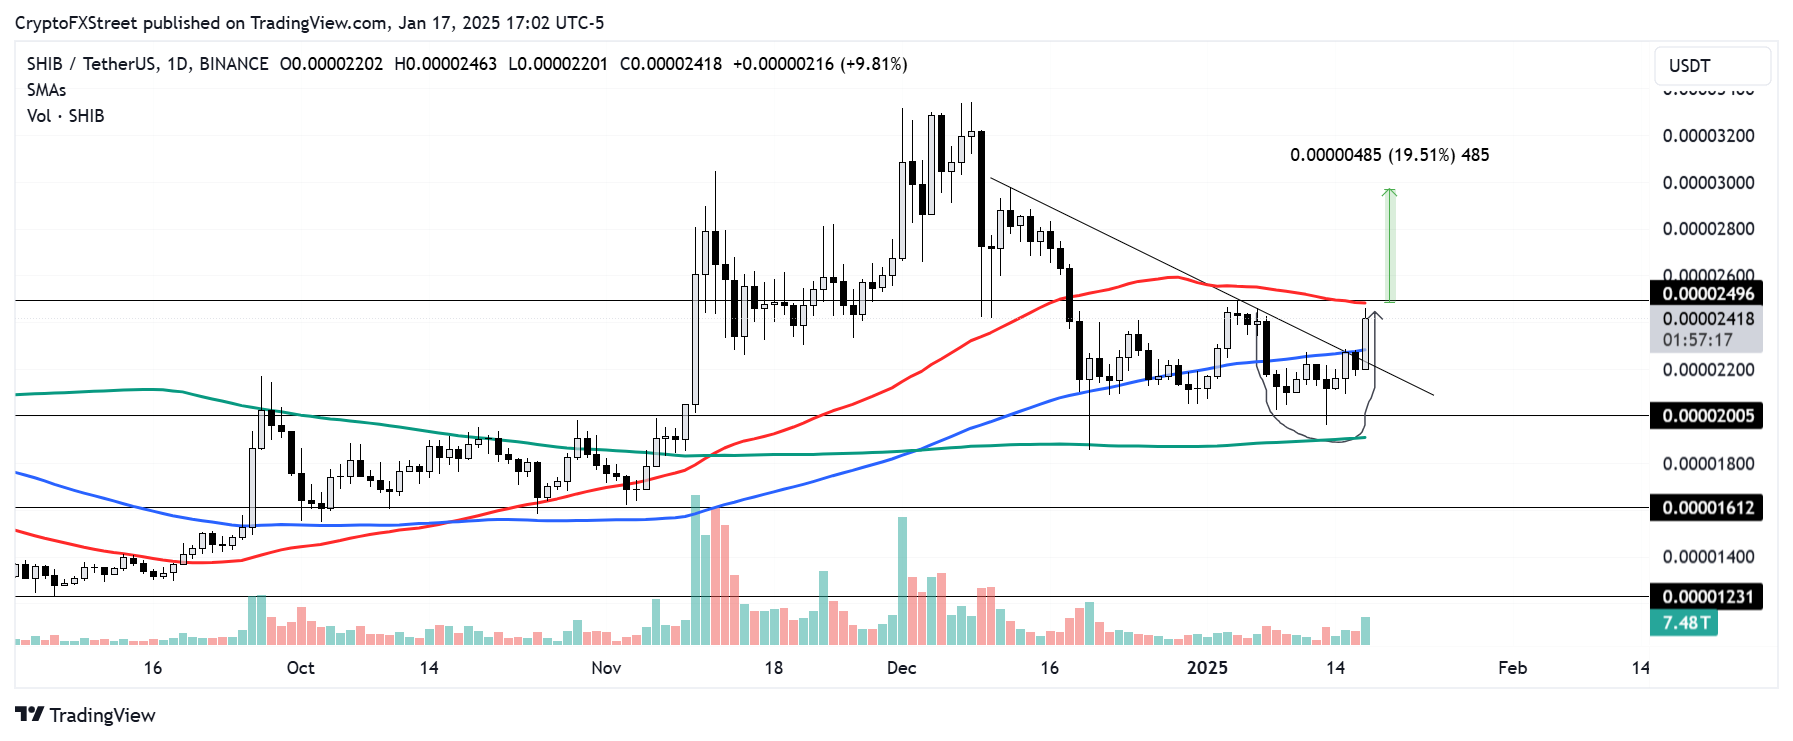
SHIB/USDT daily chart
A daily candlestick below $0.0000200 will invalidate the thesis.
PEPE could tackle its all-time high resistance at $0.0000280
PEPE has seen increased buying activity as it recorded net outflows of over $40 million across top exchanges in the past seven days.
Its open interest also saw an uptick during the week, reaching a one-year high of 28.99 trillion PEPE on Tuesday.
Following the rising OI, PEPE broke above a descending trendline resistance extending from December 9 and is looking to overcome the 50-day Simple Moving Average (SMA) hurdle.
If it holds this trendline as a support level and surge above the SMA hurdle, it could clear the resistance at $0.0000218 and rally toward its all-time high of $0.0000280.
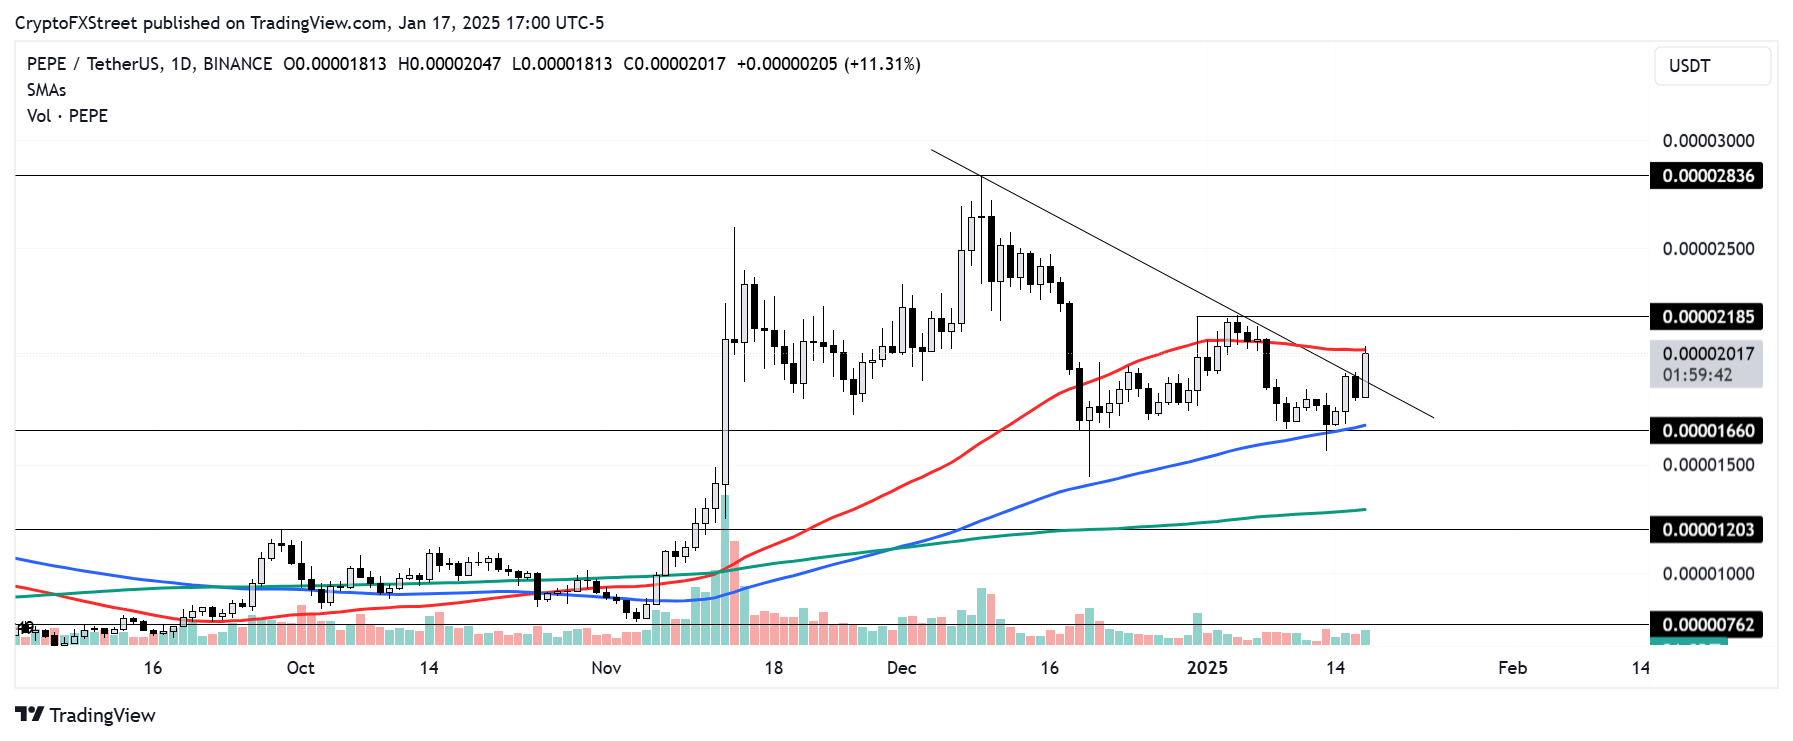
PEPE/USDT daily chart
A daily candlestick close below $0.0000166 will invalidate the thesis and send PEPE toward the $0.0000120 level.
Meanwhile, several other meme coins have rallied in the past 24 hours, including DOGE, BONK and FLOKI, rising nearly 10%.
Bài viết đề xuất


