

Ethereum Price Forecast: ETH reclaims $2,395 support but risks inflationary pressure with Unichain's launch
Ethereum Price Today: $2,440
- Ethereum price reclaimed the $2,395 support level but could see a rejection near the $2,490 resistance.
- Ethereum's inflationary pressure could rise with the launch of Unichain.
- Uniswap accounts for a large percentage of total Ethereum revenue and ETH burnt.
Ethereum (ETH) reclaimed the $2,395 support level on Friday and is attempting a move toward the $2,490 resistance. The top altcoin could face inflationary pressure in the coming months when Uniswap's Unichain goes live due to the decentralized finance protocol's large contribution to Ethereum revenue and daily burnt ETH.
Ethereum’s ‘ultrasound money’ narrative could be at further risk following the launch of Unichain
Ethereum-based decentralized exchange Uniswap announced the launch of its Layer 2 network Unichain on Thursday. Uniswap Labs stated in an X post that the new L2 will allow for faster block times, cheaper transactions and improved access to cross-chain liquidity.
Despite the news coming as a positive for UNI holders, several Ethereum community members expressed concerns that Unichain's launch might be parasitic to the Main chain and cause further harm to ETH's “ultrasound money” narrative.
Since the Dencun upgrade in March, which introduced blob space, L2s have been experiencing cheaper transactions at the expense of the Main chain's revenue. Since the upgrade in March, weekly revenue on the L1 has plunged 300% from 35.07K ETH to 8.69K ETH, per DefiLlama data. As a result, fees captured by the L1 and total burnt ETH plunged sharply. The ETH burn mechanism, introduced in the London hard fork, was a process to ensure its supply maintains a deflationary trend.
However, ETH's supply has been trending upward, adding over 300K ETH — with an annual inflation rate of 0.7% — since the upgrade, per Ultrasound.money data.
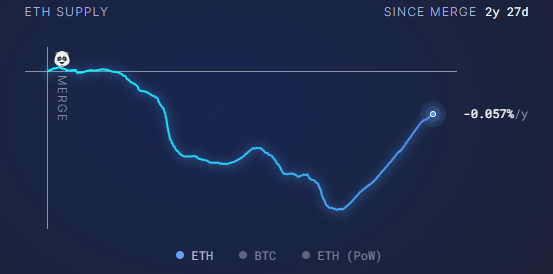
ETH Supply Growth (Source: Ultrasound.money)
While this is already a concern for most users, ETH fee capture and supply inflation could worsen in the coming months when Unichain goes live.
Uniswap currently accounts for a large percentage of the L1 revenue, with over 90% of its cumulative fees coming from settlement on the main Ethereum chain, per DefiLlama data. The loss of such a major revenue generator to the L2 world could hamper revenue growth.
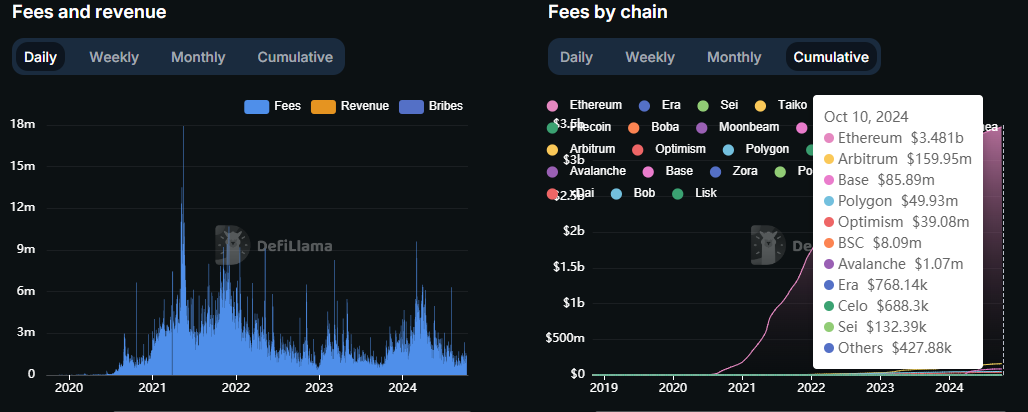
Uniswap cumulative fees across chains (Source: DefiLlama)
Secondly, Uniswap, Uniswap V2 and Uniswap V3 are among the top ten on the ETH burn leaderboard, meaning they are a major contributor to ETH supply reduction. With most of the transactions that cause such a high burn rate for Uniswap potentially moving away to Unichain when it launches, ETH supply growth could accelerate, increasing inflationary pressure and potentially weighing down on prices.
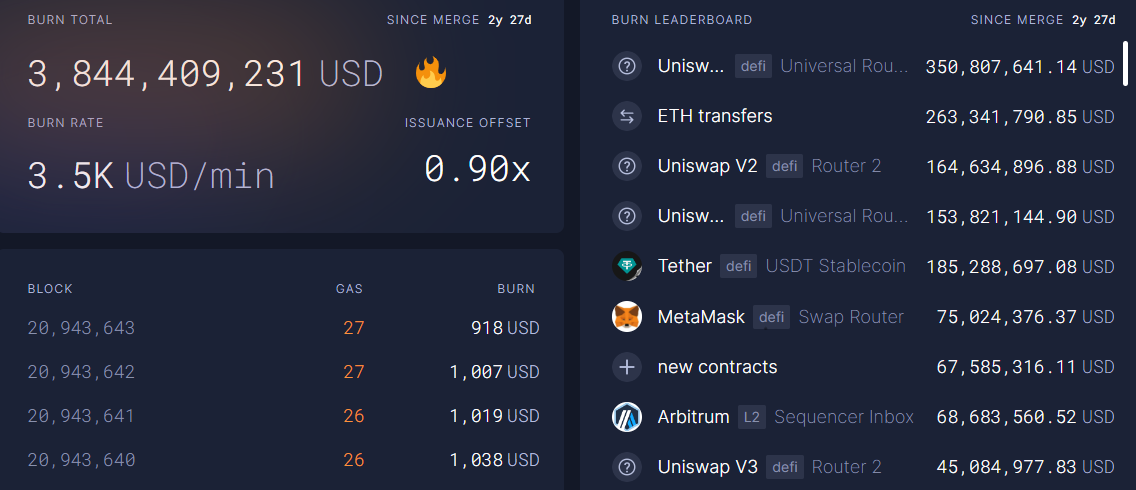
ETH Burn Leaderboard (Source: Ultrasound.money)
Meanwhile, Ethereum ETFs recorded net inflows of $10.1 million on Thursday despite the price decline, with BlackRock's ETHA posting $17.8 million in inflows, while Fidelity's FETH and Bitwise's ETHW noted outflows of $3.5 million and $4.2 million, respectively, per Farside Investors' data.
Ethereum Price Forecast: ETH could see rejection near $2,490 resistance
Ethereum is trading around $2,440 on Friday, up over 2% on the day. In the past 24 hours, ETH has seen $34.28 million in liquidations — with long and short liquidations accounting for $19.34 million and $14.95 million, respectively.
Ethereum recovered the $2,395 level in the Asian session and is attempting a move toward the $2,490 resistance. ETH could see a rejection near this resistance as it is at the same level as the 50-day Simple Moving Average (SMA), which has restricted prices in the past nine days.
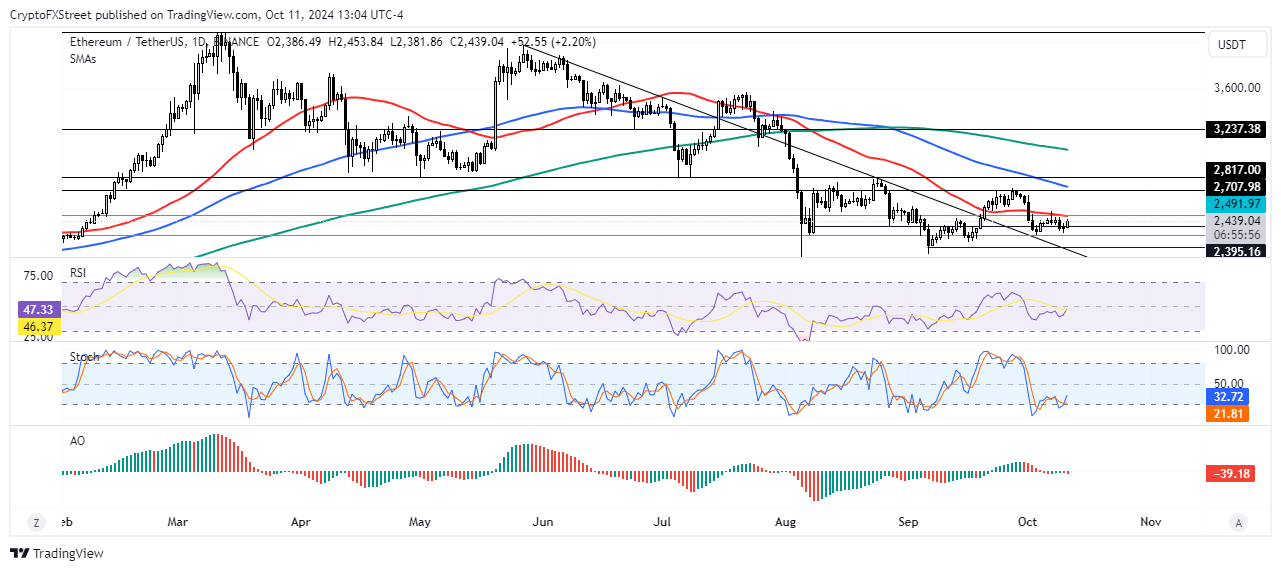
ETH/USDT daily chart
A potential rejection at $2,490 could send ETH back again to find support at $2,395.
The Relative Strength Index (RSI), Stochastic Oscillator (Stoch) and Awesome Oscillator (AO) momentum indicators are below their neutral levels at 50, 50 and 0, respectively, indicating prevailing bearish bias in the market.
A daily candlestick close below $2,200 and a breach of the key descending trendline extending from May 27 will invalidate the thesis and trigger massive correction for ETH.
Bài viết đề xuất


