

Dogecoin Price Forecast: ETF inflows and technicals fuel recovery

Nguồn Fxstreet
  • Dogecoin extends gains on Monday after finding support around the key 200-day EMA.
  • US-listed spot ETFs recorded inflows of $327,360 last week, marking the third consecutive week of inflows.
  • Strengthening derivatives metrics and a constructive technical outlook support further gains for DOGE.

Dogecoin (DOGE) extends its gains, trading above $0.096 on Monday after finding support around the key support zone last week. Continued inflows into spot DOGE Exchange Traded Funds (ETFs), alongside strengthening derivatives metrics, indicate improving market sentiment. Meanwhile, the constructive technical outlook suggests the meme coin could extend its gains if the key level holds.

DOGE’s institutional demand remains robust

SoSoValue data showed spot ETFs recorded $327,360 last week, marking the third straight week of inflows and indicating strong institutional demand. If this inflow trend continues, stays positive and intensifies through the week, the dog-themed meme coin could extend gains.
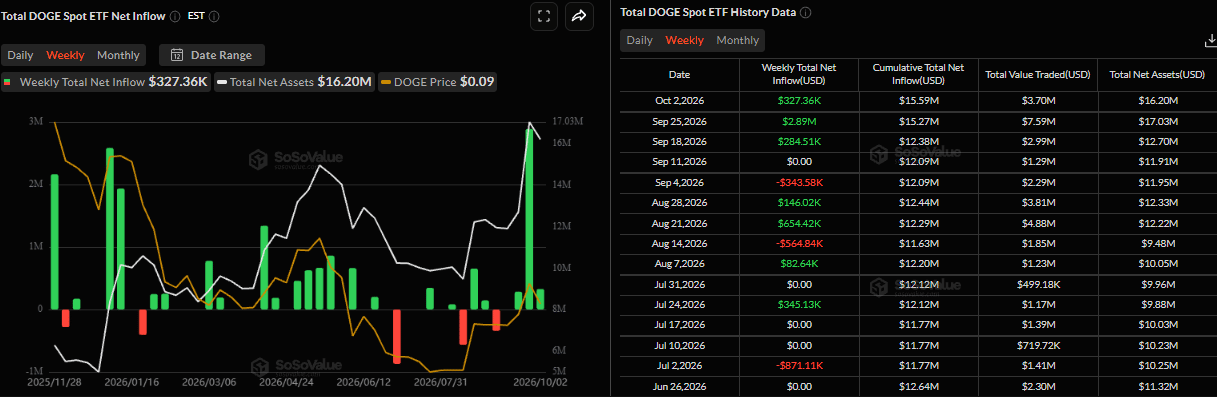
Total DOGE spot ETF net inflow weekly chart. Source: SoSoValue

Improving derivatives positioning among DOGE traders

Derivatives data shows a bullish outlook for DOGE. CoinGlass’ long-to-short ratio for DOGE reads 1.01 on Monday, flipping into green territory. A ratio above one indicates bullish sentiment, as traders bet that asset prices will rise.
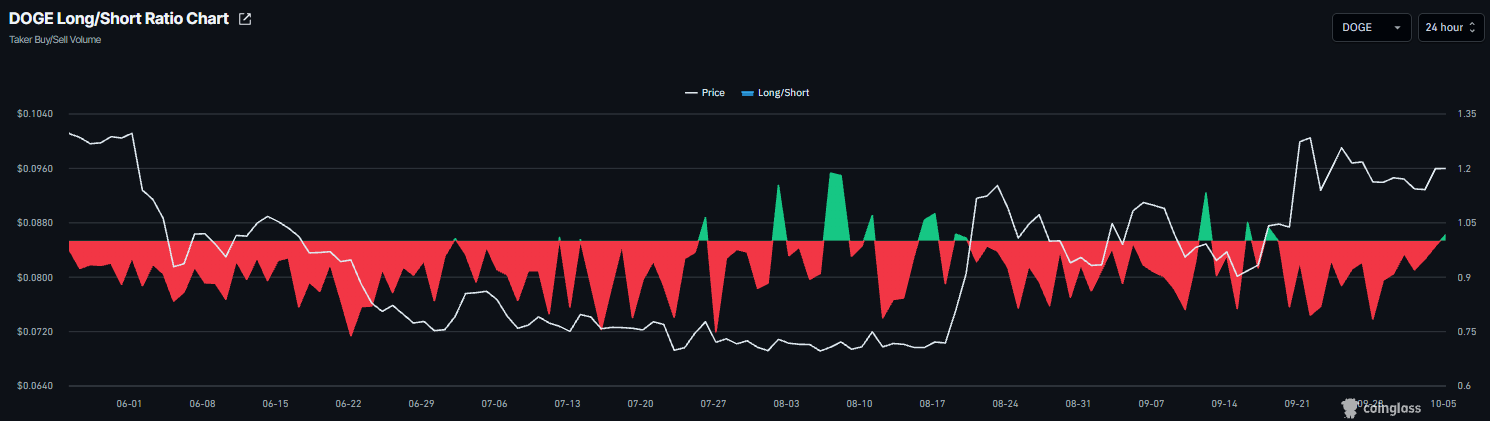
DOGE long-to-short ratio chart. Source: Coinglass

In addition, Dogecoin’s funding rate flipped positive on September 10 and rose to 0.0092% on Monday. This indicates longs are paying shorts, reflecting a bullish outlook for Dogecoin.
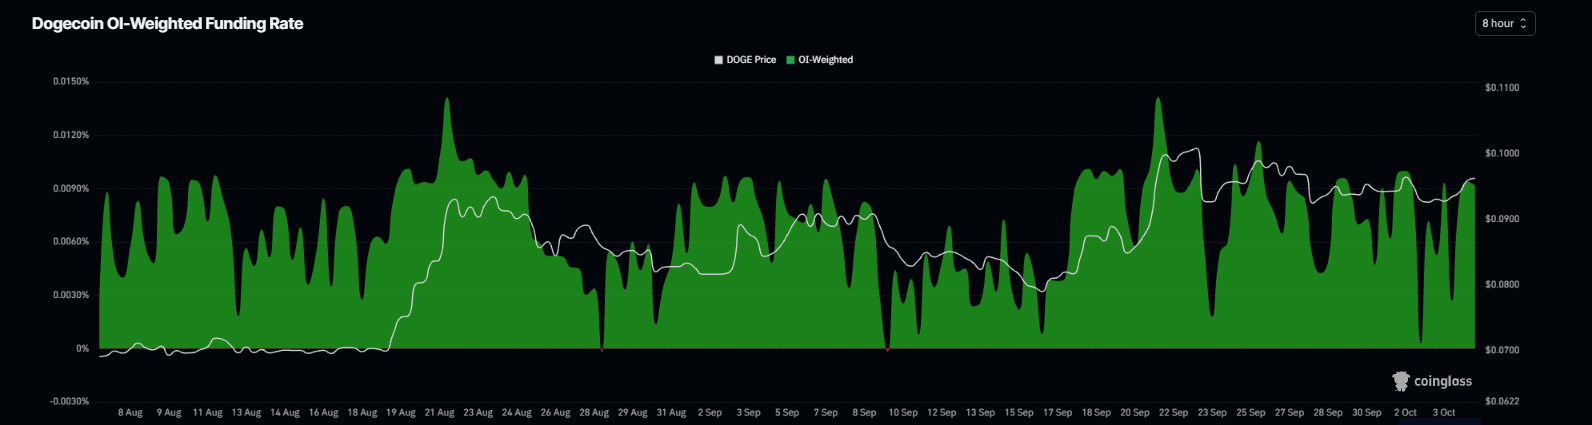
DOGE funding rates chart. Source: Coinglass

Dogecoin technical outlook: 200-day EMA holds strong

Dogecoin price trades around $0.096 on Monday, maintaining a bullish near-term bias as it holds above the 200-day exponential moving average (EMA) at $0.093, with the shorter 50-day and 100-day EMAs clustered between roughly $0.086 and $0.088.

The Relative Strength Index (RSI) near 58 suggests constructive but not overextended momentum. At the same time, the Moving Average Convergence Divergence (MACD) has slipped marginally into negative territory, hinting at a mild loss of upside pressure rather than a decisive trend change.

On the downside, immediate support is at the 200-day EMA near $0.093, with additional demand at the horizontal level of $0.088 and the nearby 50-day EMA at $0.088; deeper support emerges at the 100-day EMA around $0.086, ahead of the more distant structural floors at $0.070.

On the topside, initial resistance is defined by the horizontal barrier at $0.102, and a sustained move above this cap would open the way for a continuation of the broader recovery phase.
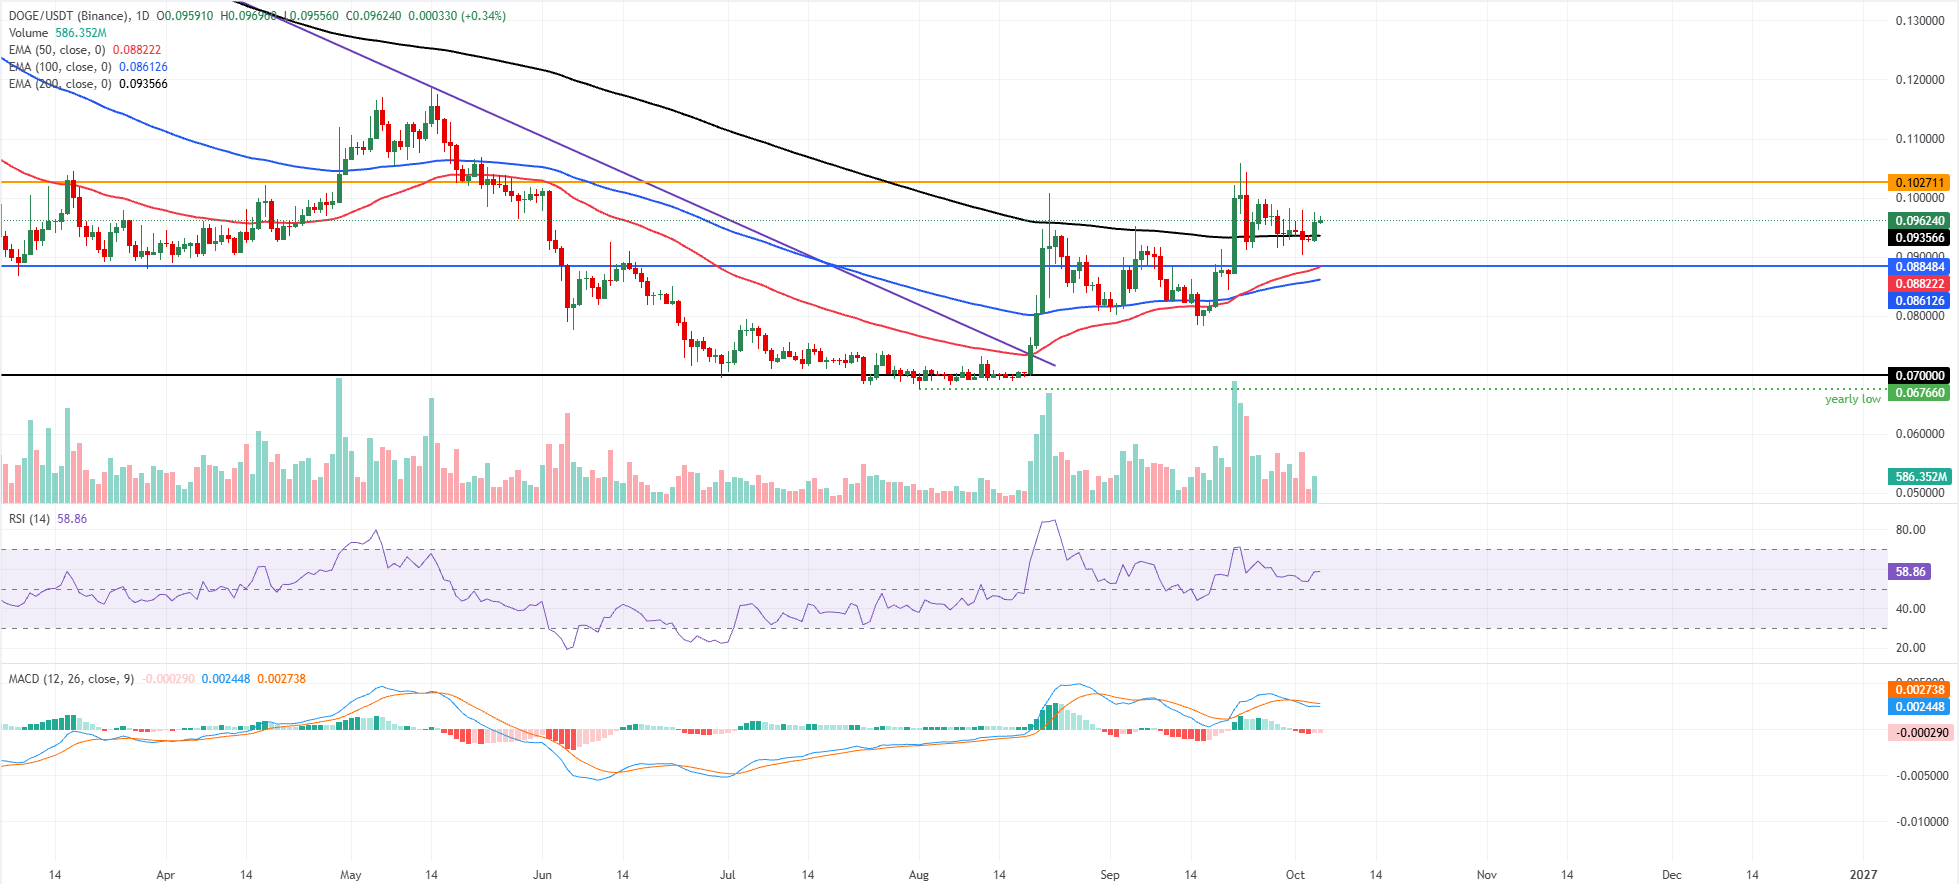
DOGE/USDT daily chart

(The technical analysis of this story was written with the help of an AI tool. Know more.)

Tuyên bố miễn trừ trách nhiệm: Chỉ dành cho mục đích thông tin. Hiệu suất trong quá khứ không đảm bảo cho kết quả trong tương lai.
placeholder
WTI giữ vững trên mức 84,50$ khi lo ngại gia tăng về các lệnh trừng phạt của Mỹ đối với IranGiá dầu West Texas Intermediate (WTI) tăng sau khi ghi nhận mức giảm hơn 2% trong ngày trước đó, giao dịch quanh mức 84,70$/thùng trong giờ châu Á vào thứ Ba.
Tác giả  FXStreet
8 tháng 25 ngày Thứ Ba
Giá dầu West Texas Intermediate (WTI) tăng sau khi ghi nhận mức giảm hơn 2% trong ngày trước đó, giao dịch quanh mức 84,70$/thùng trong giờ châu Á vào thứ Ba.
placeholder
Dự báo Bảng lương Phi nông nghiệp Mỹ tháng 9: Tăng trưởng việc làm có thể hạ nhiệt, cổ phiếu Mỹ, đồng USD và vàng sẽ phản ứng ra sao?Vào thứ Sáu, ngày 2 tháng 10 (theo giờ EDT), Mỹ sẽ công bố báo cáo bảng lương phi nông nghiệp tháng 9, trong đó thị trường tập trung vào việc liệu đà tăng trưởng việc làm có thể duy trì s
Tác giả  TradingKey
10 tháng 01 ngày Thứ Năm
Vào thứ Sáu, ngày 2 tháng 10 (theo giờ EDT), Mỹ sẽ công bố báo cáo bảng lương phi nông nghiệp tháng 9, trong đó thị trường tập trung vào việc liệu đà tăng trưởng việc làm có thể duy trì s
placeholder
Chỉ số đô la Mỹ của Hoa Kỳ đang ở gần mức cao nhất tháng 3 năm 2025, trên 102,00 trước thềm công bố Bảng lương phi nông nghiệp (NFP) của MỹChỉ số Đô la Mỹ (DXY), theo dõi giá trị của Đồng bạc xanh so với một rổ tiền tệ, thu hút người mua trong ngày thứ năm liên tiếp và tăng trở lại trên mốc 102,00 trong phiên giao dịch châu Á vào thứ Sáu.
Tác giả  FXStreet
10 tháng 02 ngày Thứ Sáu
Chỉ số Đô la Mỹ (DXY), theo dõi giá trị của Đồng bạc xanh so với một rổ tiền tệ, thu hút người mua trong ngày thứ năm liên tiếp và tăng trở lại trên mốc 102,00 trong phiên giao dịch châu Á vào thứ Sáu.
placeholder
Dự báo giá WTI: giảm xuống 91,50$ khi những lo ngại ở Trung Đông hạn chế đà giảmWest Texas Intermediate (WTI) – giá dầu thô chuẩn của Mỹ – thu hút một số bên bán trong phiên châu Á vào thứ Sáu, chấm dứt chuỗi tăng hai ngày và làm chững lại đà phục hồi của ngày hôm trước từ vùng lân cận mức thấp gần bốn tuần.
Tác giả  FXStreet
10 tháng 02 ngày Thứ Sáu
West Texas Intermediate (WTI) – giá dầu thô chuẩn của Mỹ – thu hút một số bên bán trong phiên châu Á vào thứ Sáu, chấm dứt chuỗi tăng hai ngày và làm chững lại đà phục hồi của ngày hôm trước từ vùng lân cận mức thấp gần bốn tuần.
placeholder
Đồng euro suy yếu xuống dưới 1,1250 do rủi ro tài khóa của PhápCặp EUR/USD mất đà xuống khoảng 1,1245 trong đầu phiên giao dịch châu Á vào thứ Hai. Đồng euro (EUR) suy yếu so với đồng đô la Mỹ (USD) trong bối cảnh lo ngại về quỹ đạo tài khóa bấp bênh của Pháp. Báo cáo Chỉ số người quản lý mua hàng (PMI) ngành dịch vụ ISM của Mỹ sẽ được công bố vào cuối ngày thứ Hai.
Tác giả  FXStreet
3 giờ trước
Cặp EUR/USD mất đà xuống khoảng 1,1245 trong đầu phiên giao dịch châu Á vào thứ Hai. Đồng euro (EUR) suy yếu so với đồng đô la Mỹ (USD) trong bối cảnh lo ngại về quỹ đạo tài khóa bấp bênh của Pháp. Báo cáo Chỉ số người quản lý mua hàng (PMI) ngành dịch vụ ISM của Mỹ sẽ được công bố vào cuối ngày thứ Hai.
sản phẩm liên quan
goTop
quote