
Crypto Today: Bitcoin, Ethereum, XRP bulls remain in control amid ETF inflows
- Bitcoin rises above the 50-day EMA, supported by a resurgence of ETF inflows.
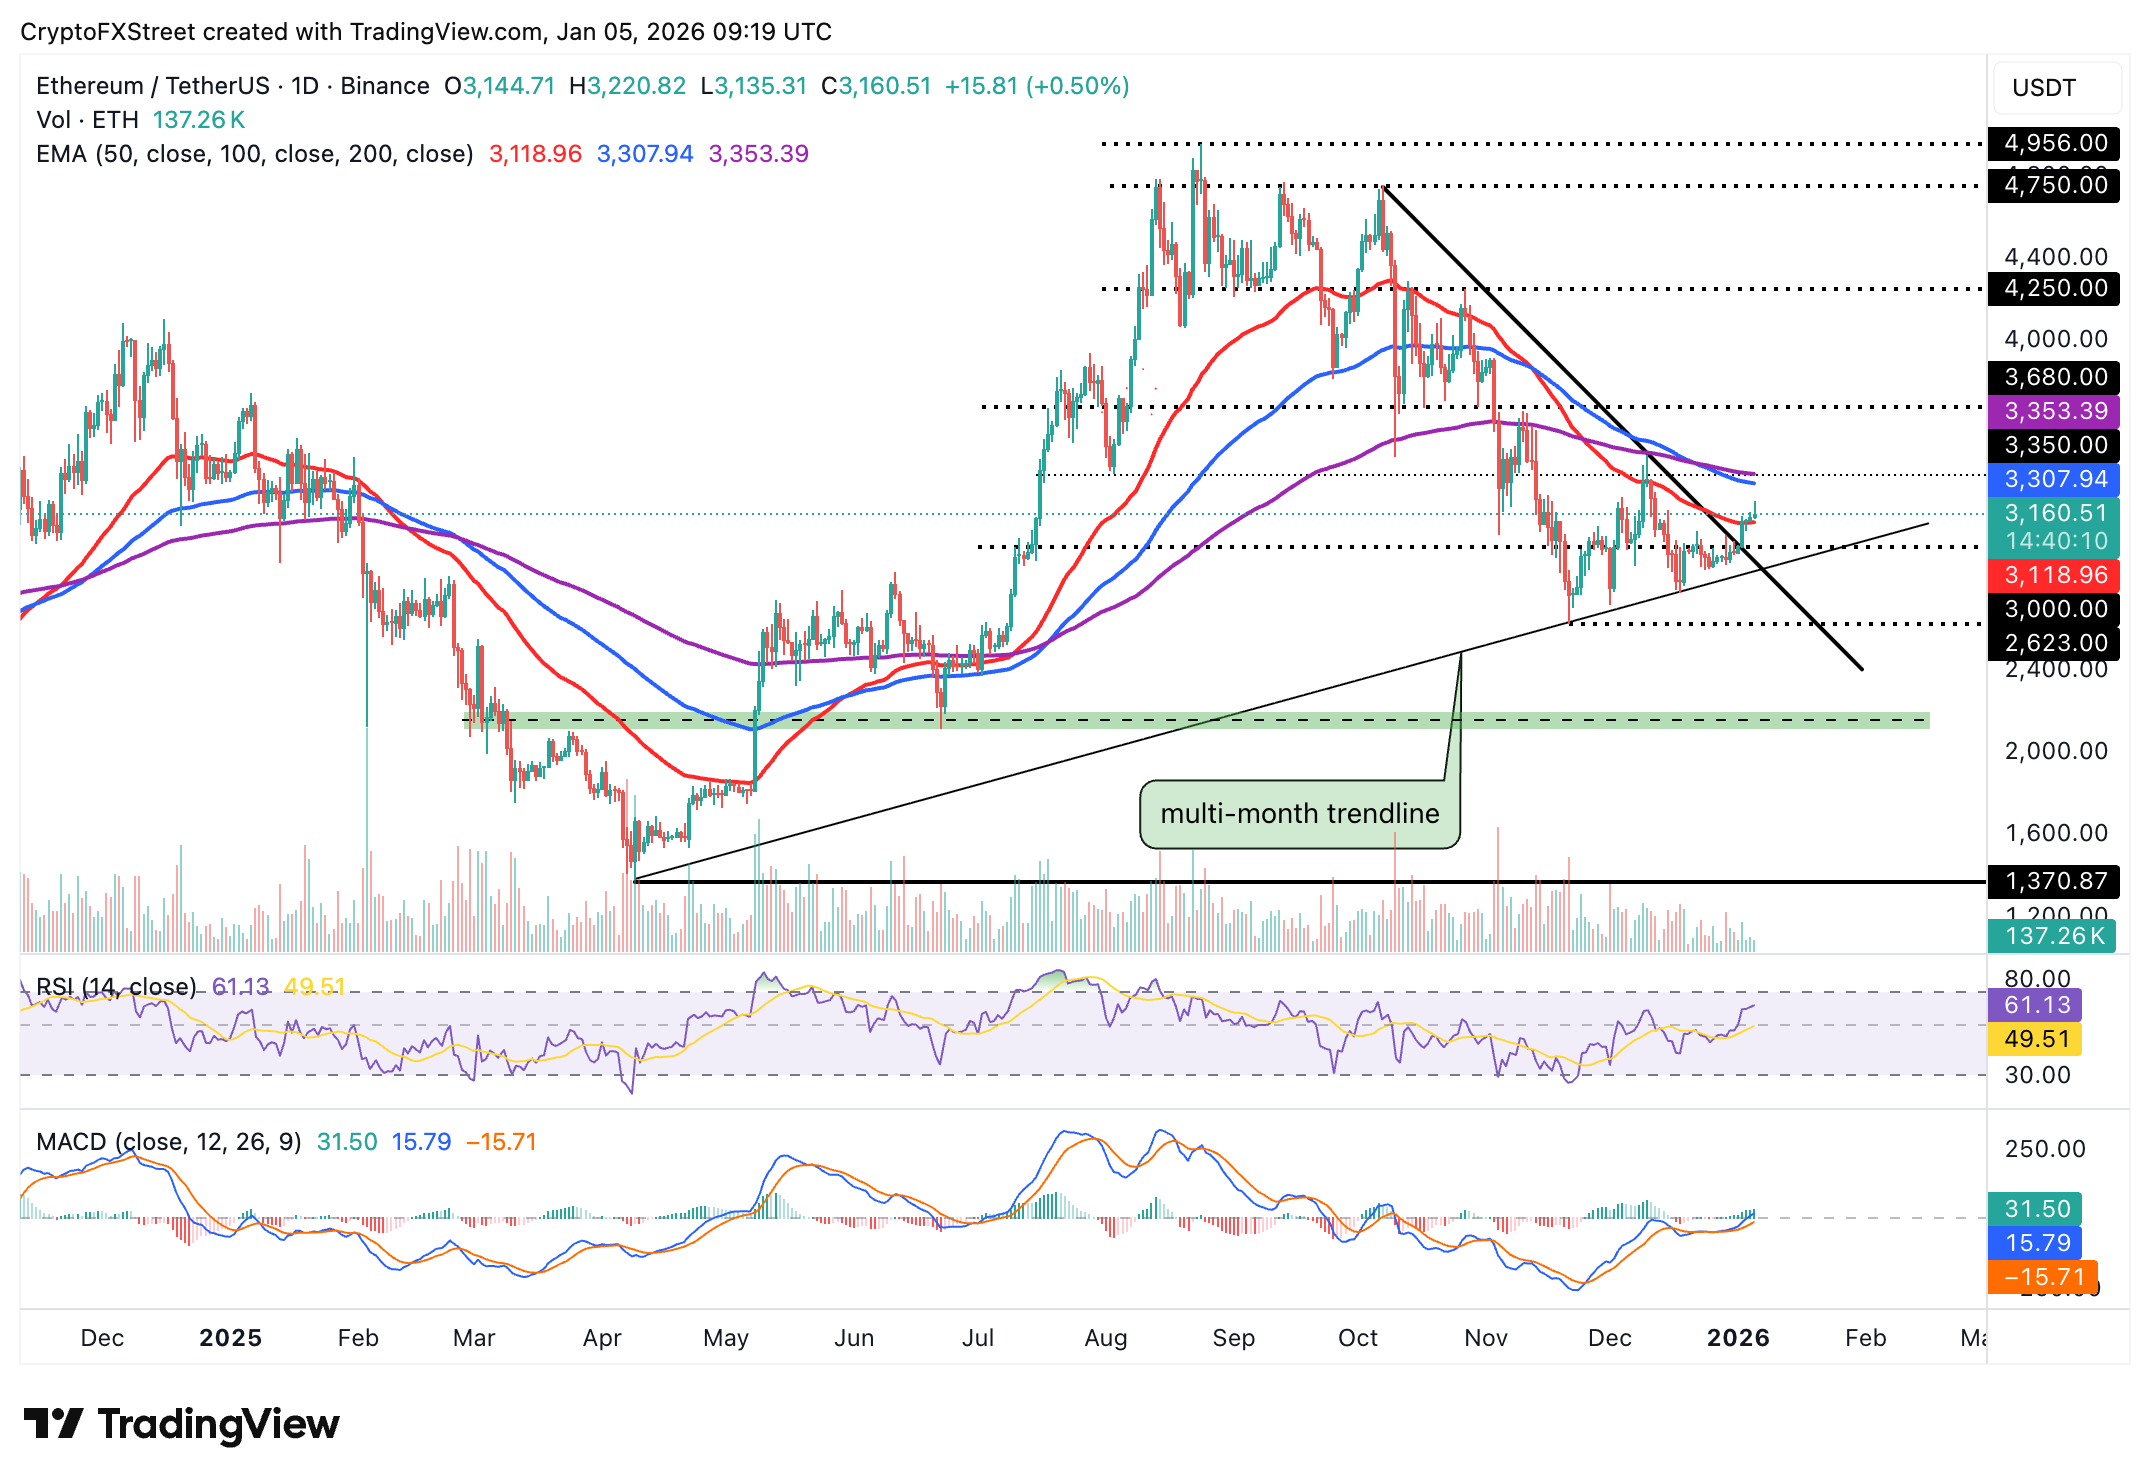
- Ethereum remains above $3,100 as the crypto market broadly shrugs off mounting geopolitical tensions.
- The MACD and the RSI indicators support XRP’s short-term bullish outlook.
Bitcoin (BTC) is trading above $92,500 at the time of writing on Monday, as investors lean into fresh risk amid escalating geopolitical tensions after the United States (US) captured Venezuela’s President Nicholas Maduro during the weekend.
Ethereum (ETH) edges up above $3,100, supported by positive weekly flows into spot Exchange Traded Funds (ETFs). Meanwhile, Ripple (XRP) is up nearly 3% on the day, supported by growing institutional interest.
BTC, ETH, XRP show strength backed by ETF inflows
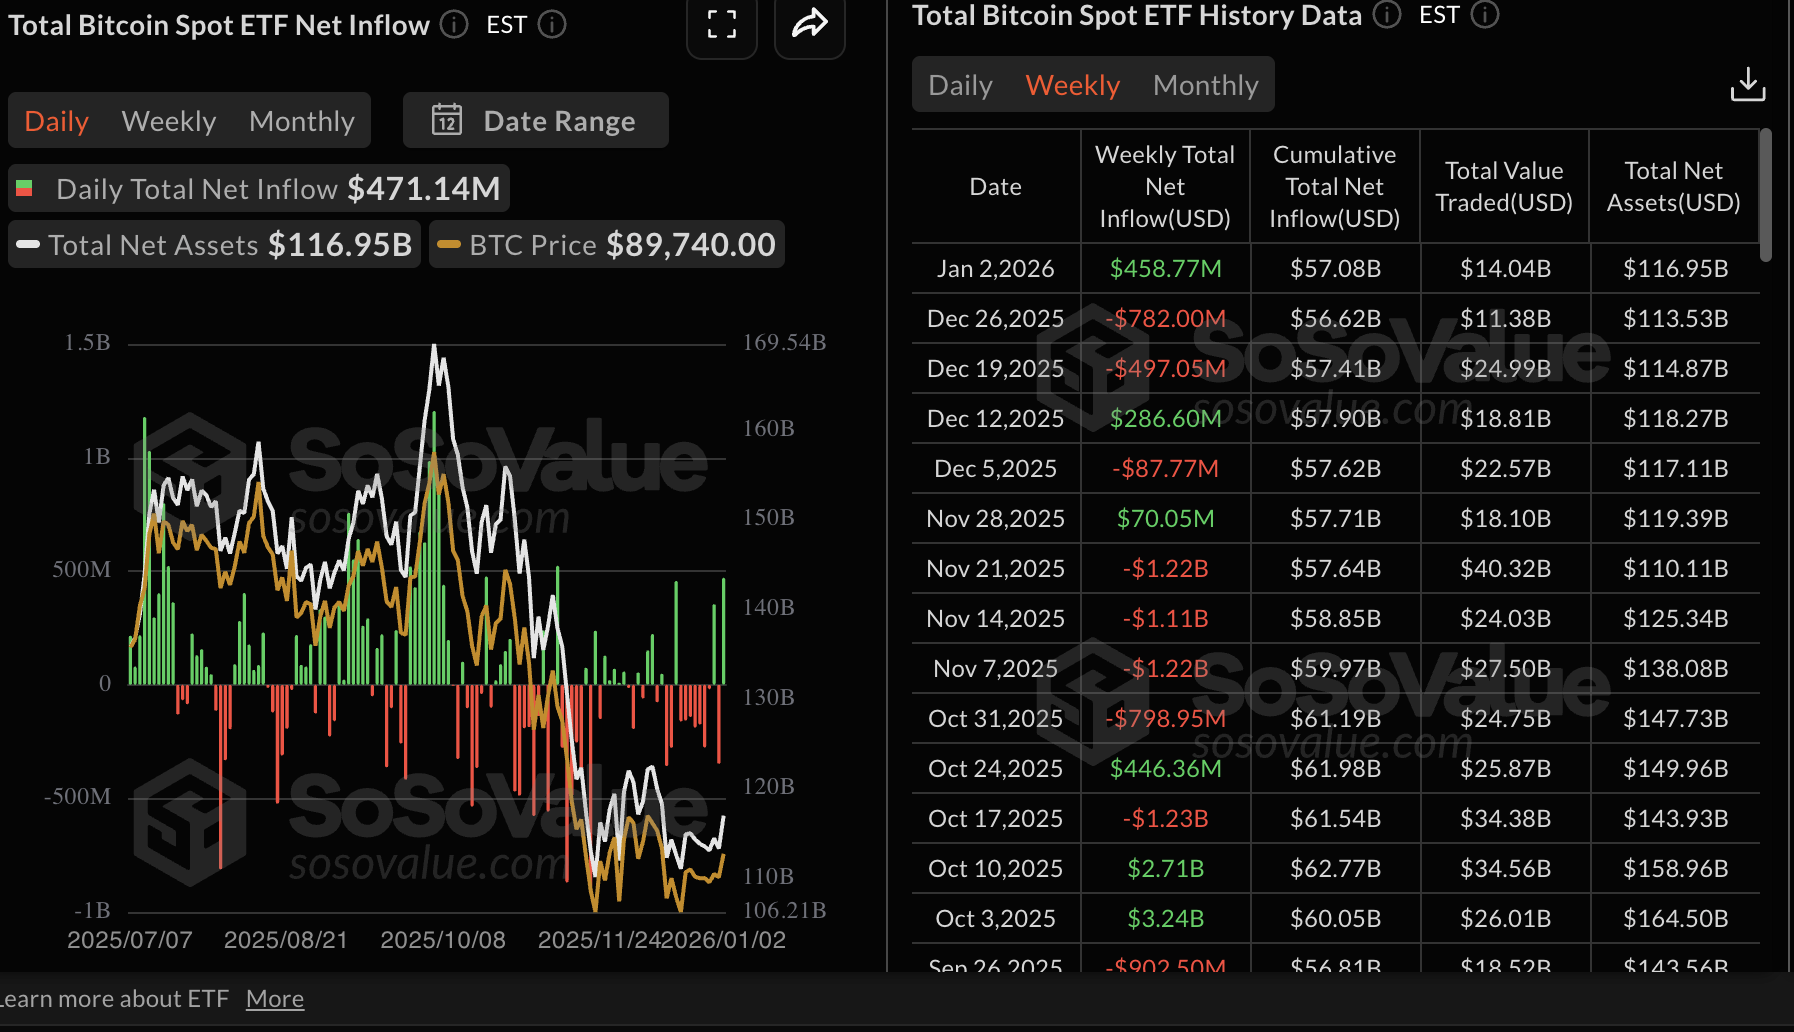
Weekly inflows into Bitcoin spot ETFs resumed last week, drawing approximately $459 million. This inflow occurred despite choppy end-of-year prices, signalling a potential resurgence in institutional interest. SoSoValue data shows that US-listed BTC ETFs saw $471 million in inflows on Friday, bringing the cumulative net inflow to approximately $57 billion and net assets to $117 billion.
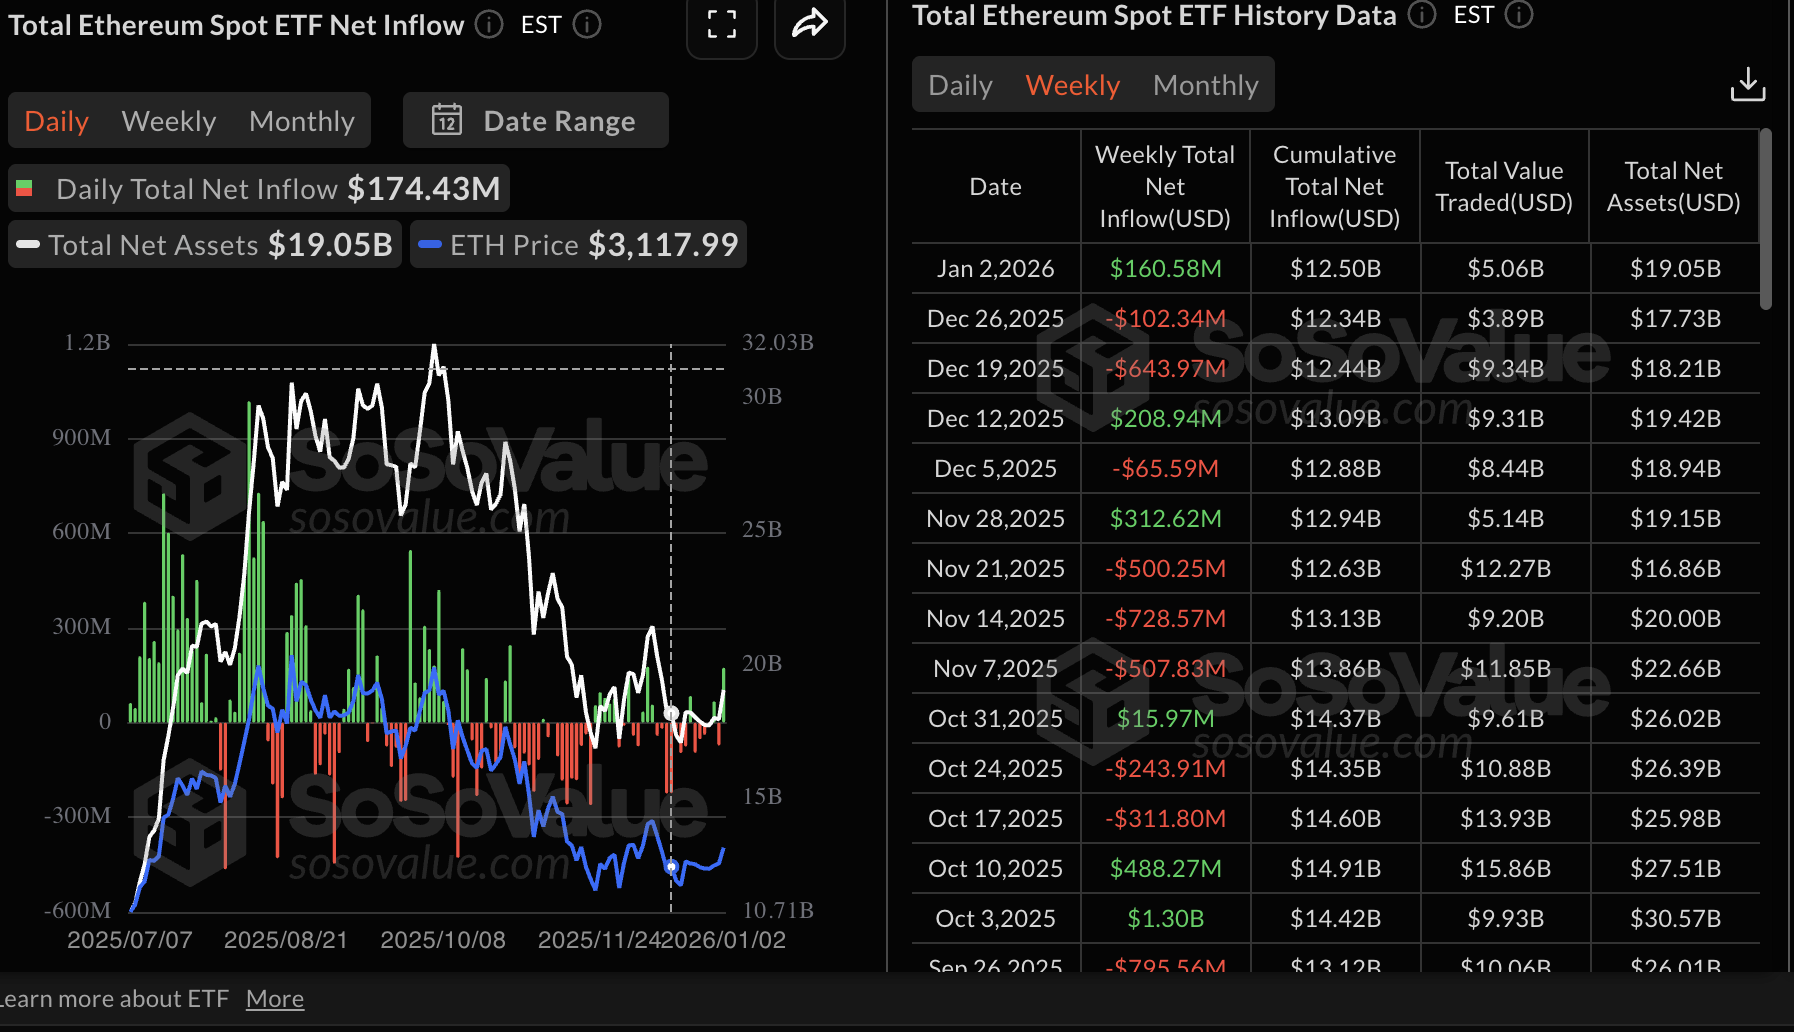
Ethereum spot ETFs resumed inflows last week, totaling approximately $161 million. This inflow followed two consecutive weeks of outflows, which may signal growing interest among institutional investors. Approximately $174 million in inflows was recorded on Friday, pushing the cumulative inflow volume to $12.50 billion and net assets to $19.05 billion.
Meanwhile, XRP ETFs extended their inflow streak, drawing roughly $43 million last week. Approximately $13.6 million in inflows was recorded on Friday, pushing the cumulative inflow volume to $1.18 billion and net assets to $1.37 billion.
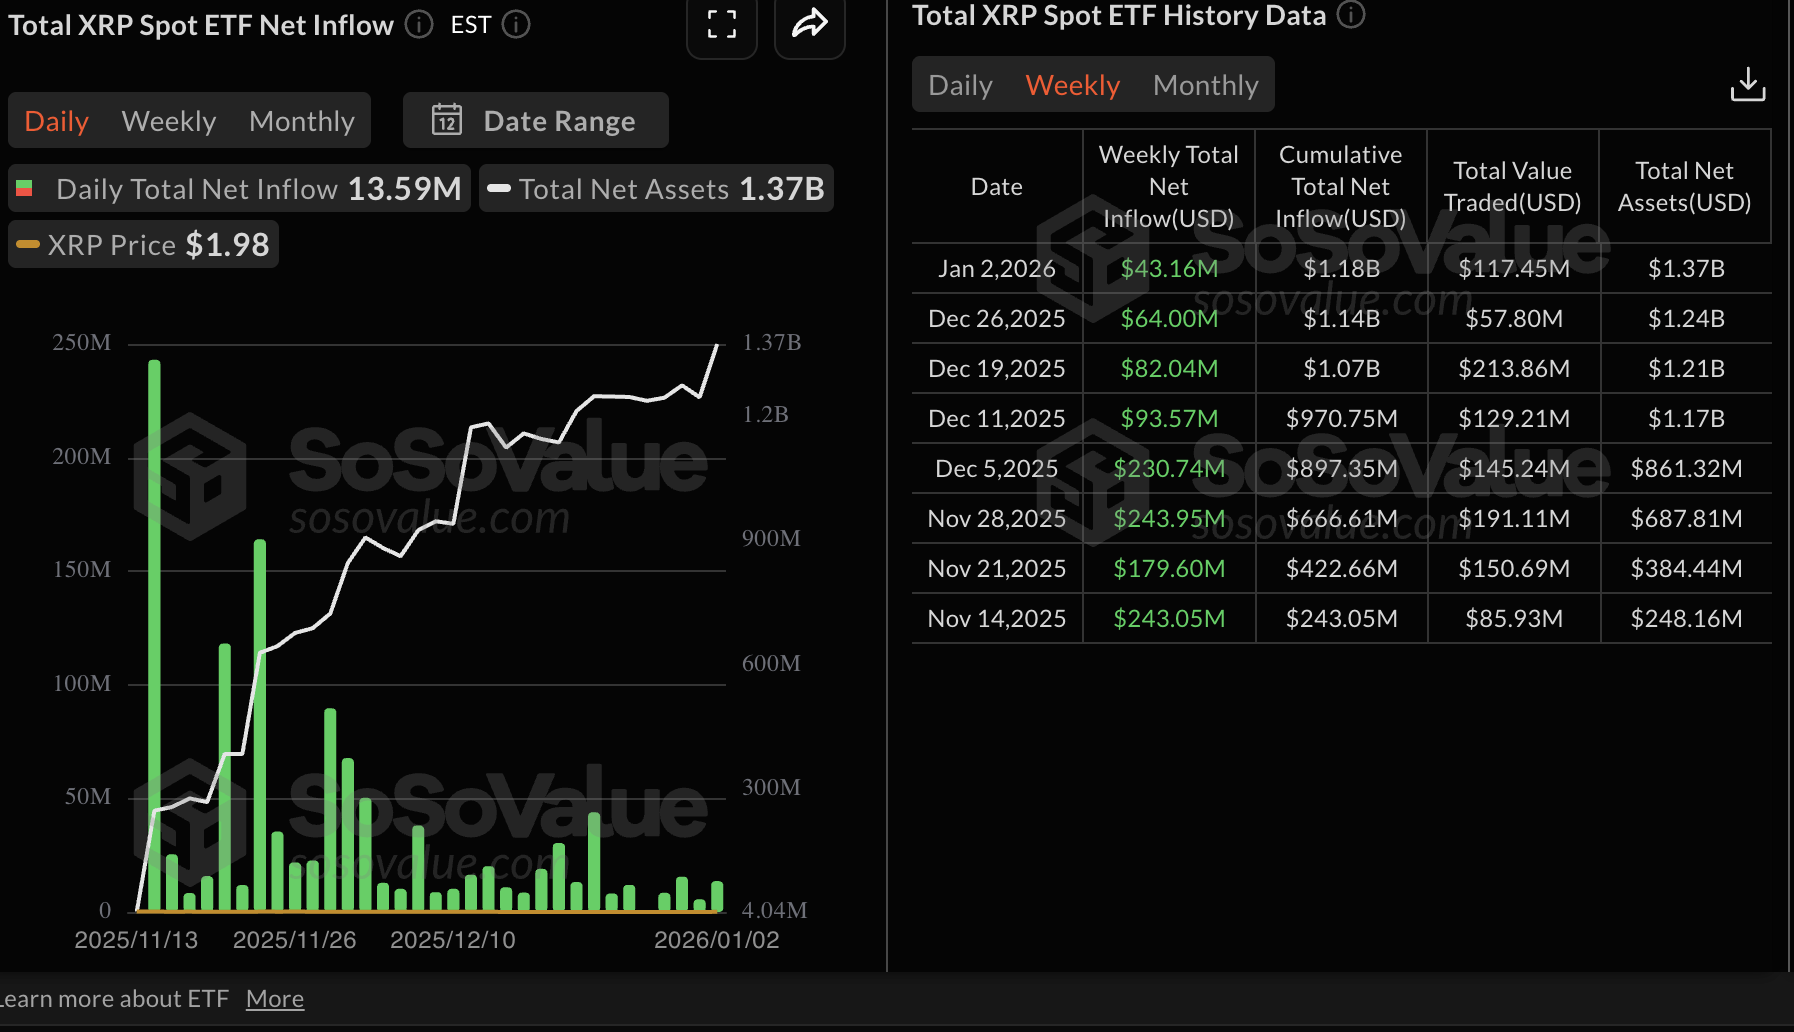
Chart of the day: Bitcoin holds key support
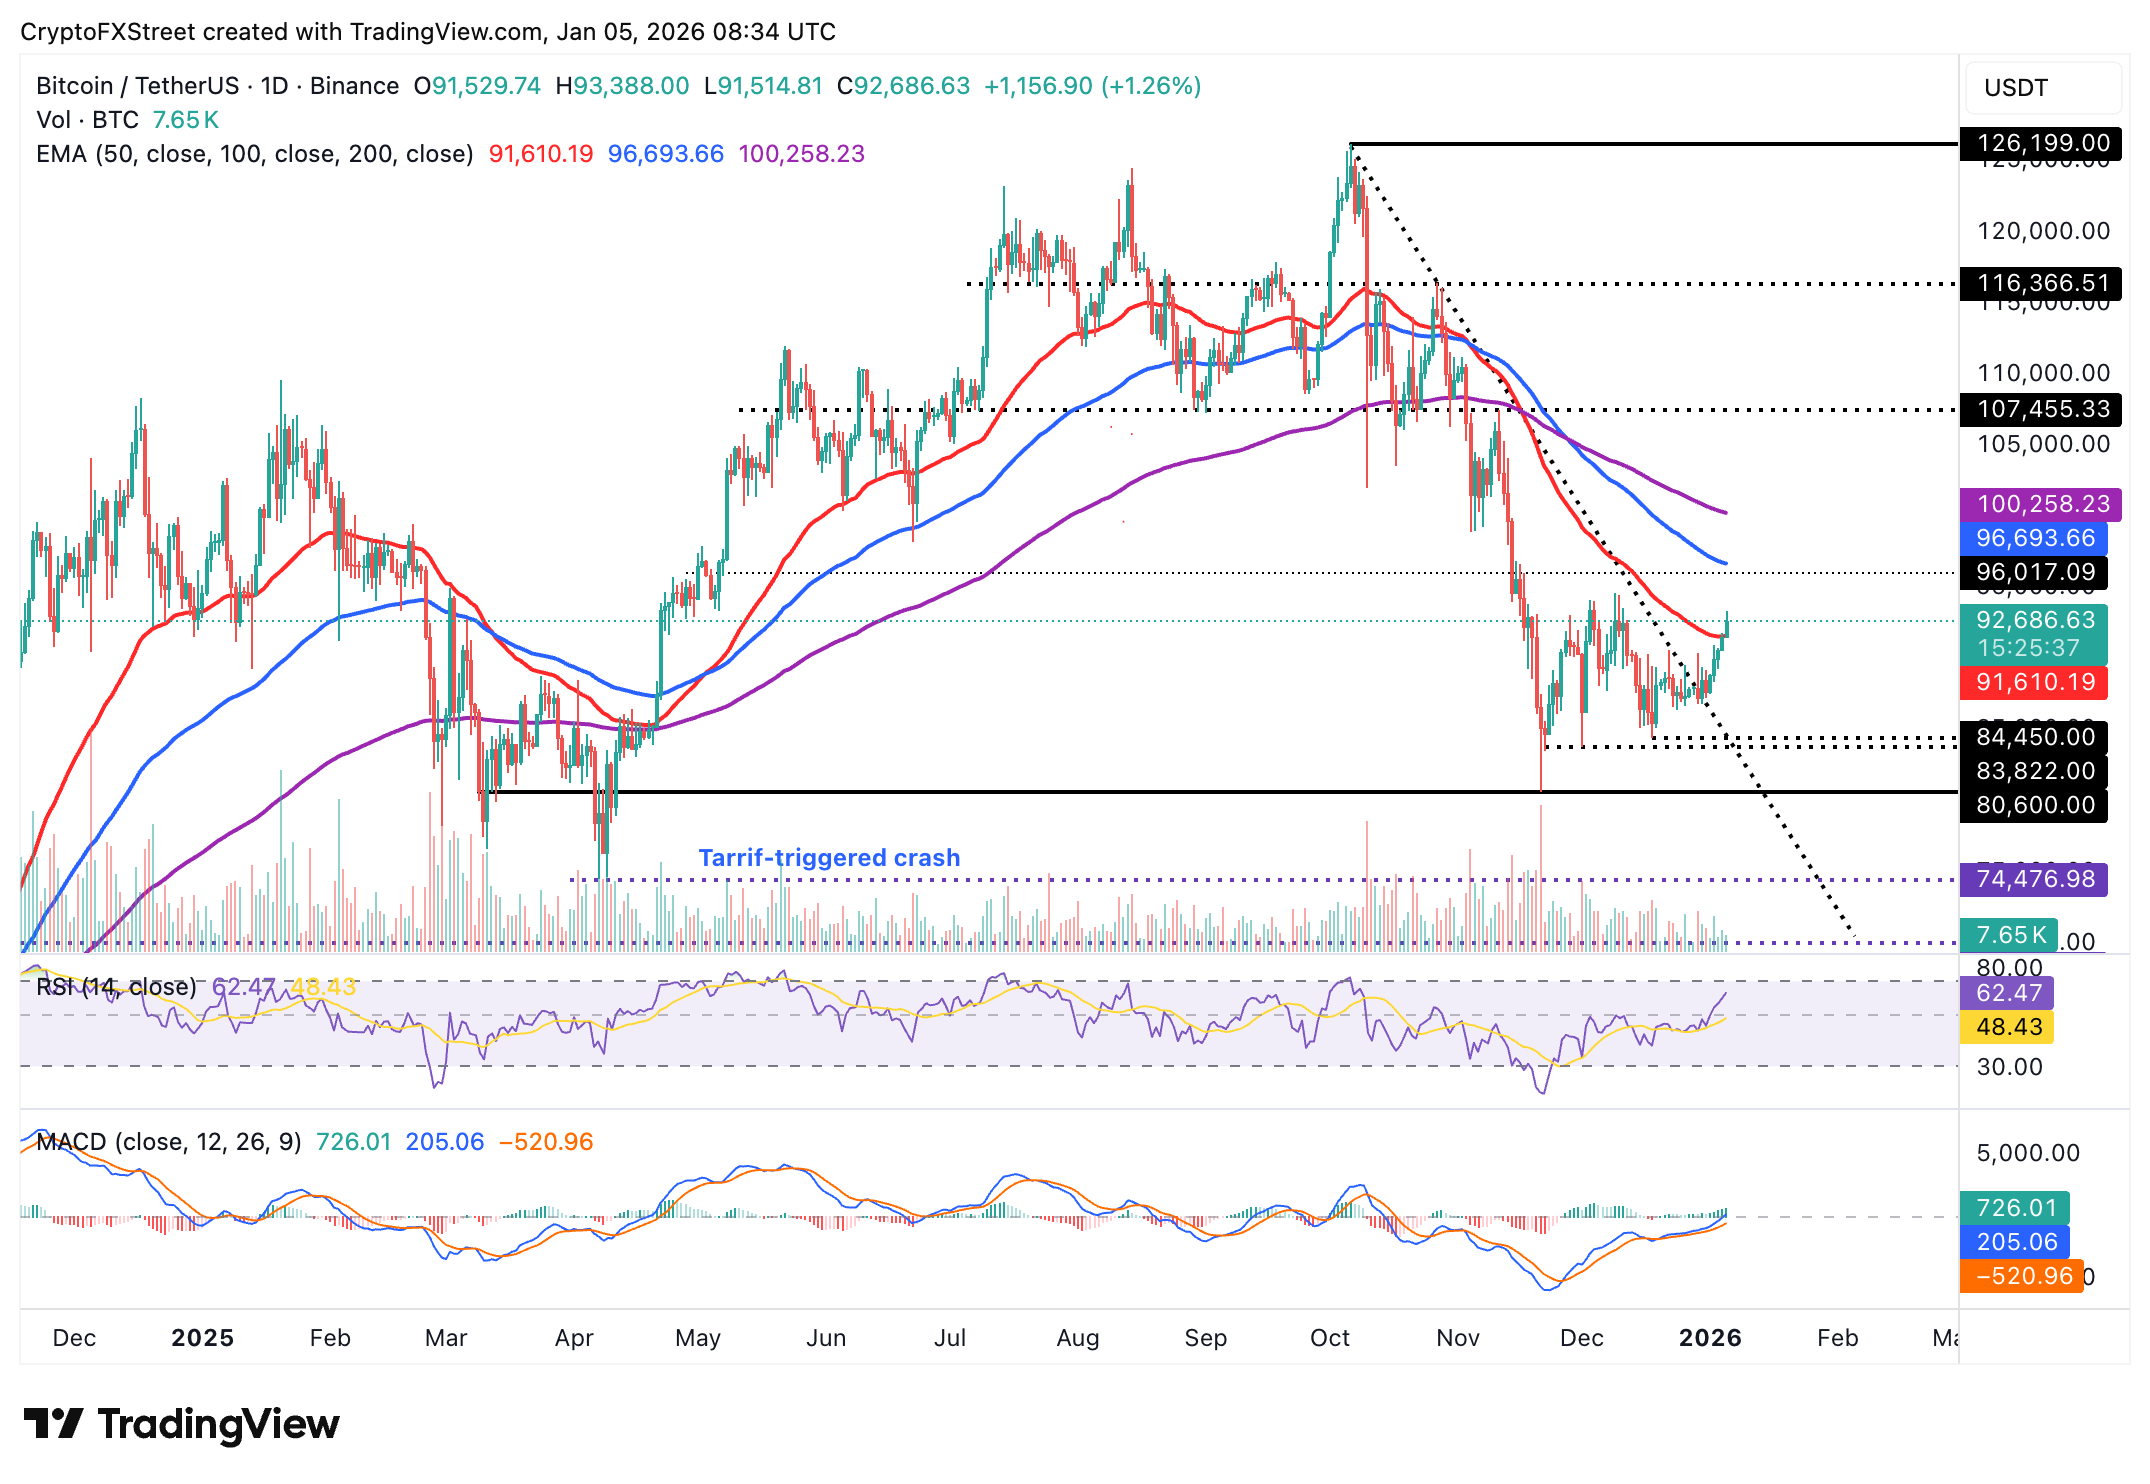
Bitcoin is trading above the 50-day Exponential Moving Average (EMA) at $91,610 at the time of writing on Monday. It is up over 1% on the day and sits above $92,500. An uptrending Relative Strength Index (RSI) holds at 62 on the daily chart, which reinforces BTC’s bullish outlook.
The Moving Average Convergence Divergence (MACD) indicator on the same chart has crossed above the mean line, suggesting that bulls have the upper hand. If the blue MACD line holds above the red signal line as the indicator generally rises, the path with the least resistance could remain upward, increasing the odds of a breakout above the 100-day EMA resistance at $96,693.
The 50-day EMA plays an important role in providing immediate support, which keeps the uptrend intact. However, if broken due to risk-off sentiment as geopolitical tensions thaw, a return below $90,000 would be on the cards.
Altcoins update: Ethereum, XRP hold steady
Ethereum is trading above the 50-day EMA at the time of writing on Monday. The recovery experienced over the last five days signals growing retail and institutional demand.
The RSI on the daily chart is at 60 and rising, albeit gradually. A continued uptrend toward overbought territory would reinforce the bullish grip and increase the chances of a breakout above the 100-day EMA at $3,307 and the 200-day EMA at $3,353.
The MACD indicator on the same chart continues to show positive divergence, with the blue line holding above the signal line. Green histogram bars are also expanding above the mean line, backing ETH’s bullish thesis.
Traders will watch out for a close above the 50-day EMA to gauge Ethereum’s recovery potential. Conversely, trading below the same moving average could encourage profit-taking amid fears of another dip below $3,000.
As for XRP, bulls are largely in control, with the price hovering around $2.14 at the time of writing on Monday. The cross-border money remittance token holds above the 50-day EMA at $2.04, signaling that bulls have the upper hand.
The MACD indicator on the daily chart supports XRP’s bullish outlook as it lifts above the mean line while the green histogram bars expand. The RSI on the same daily chart is at 65 and is gradually rising in support of XRP’s bullish potential.
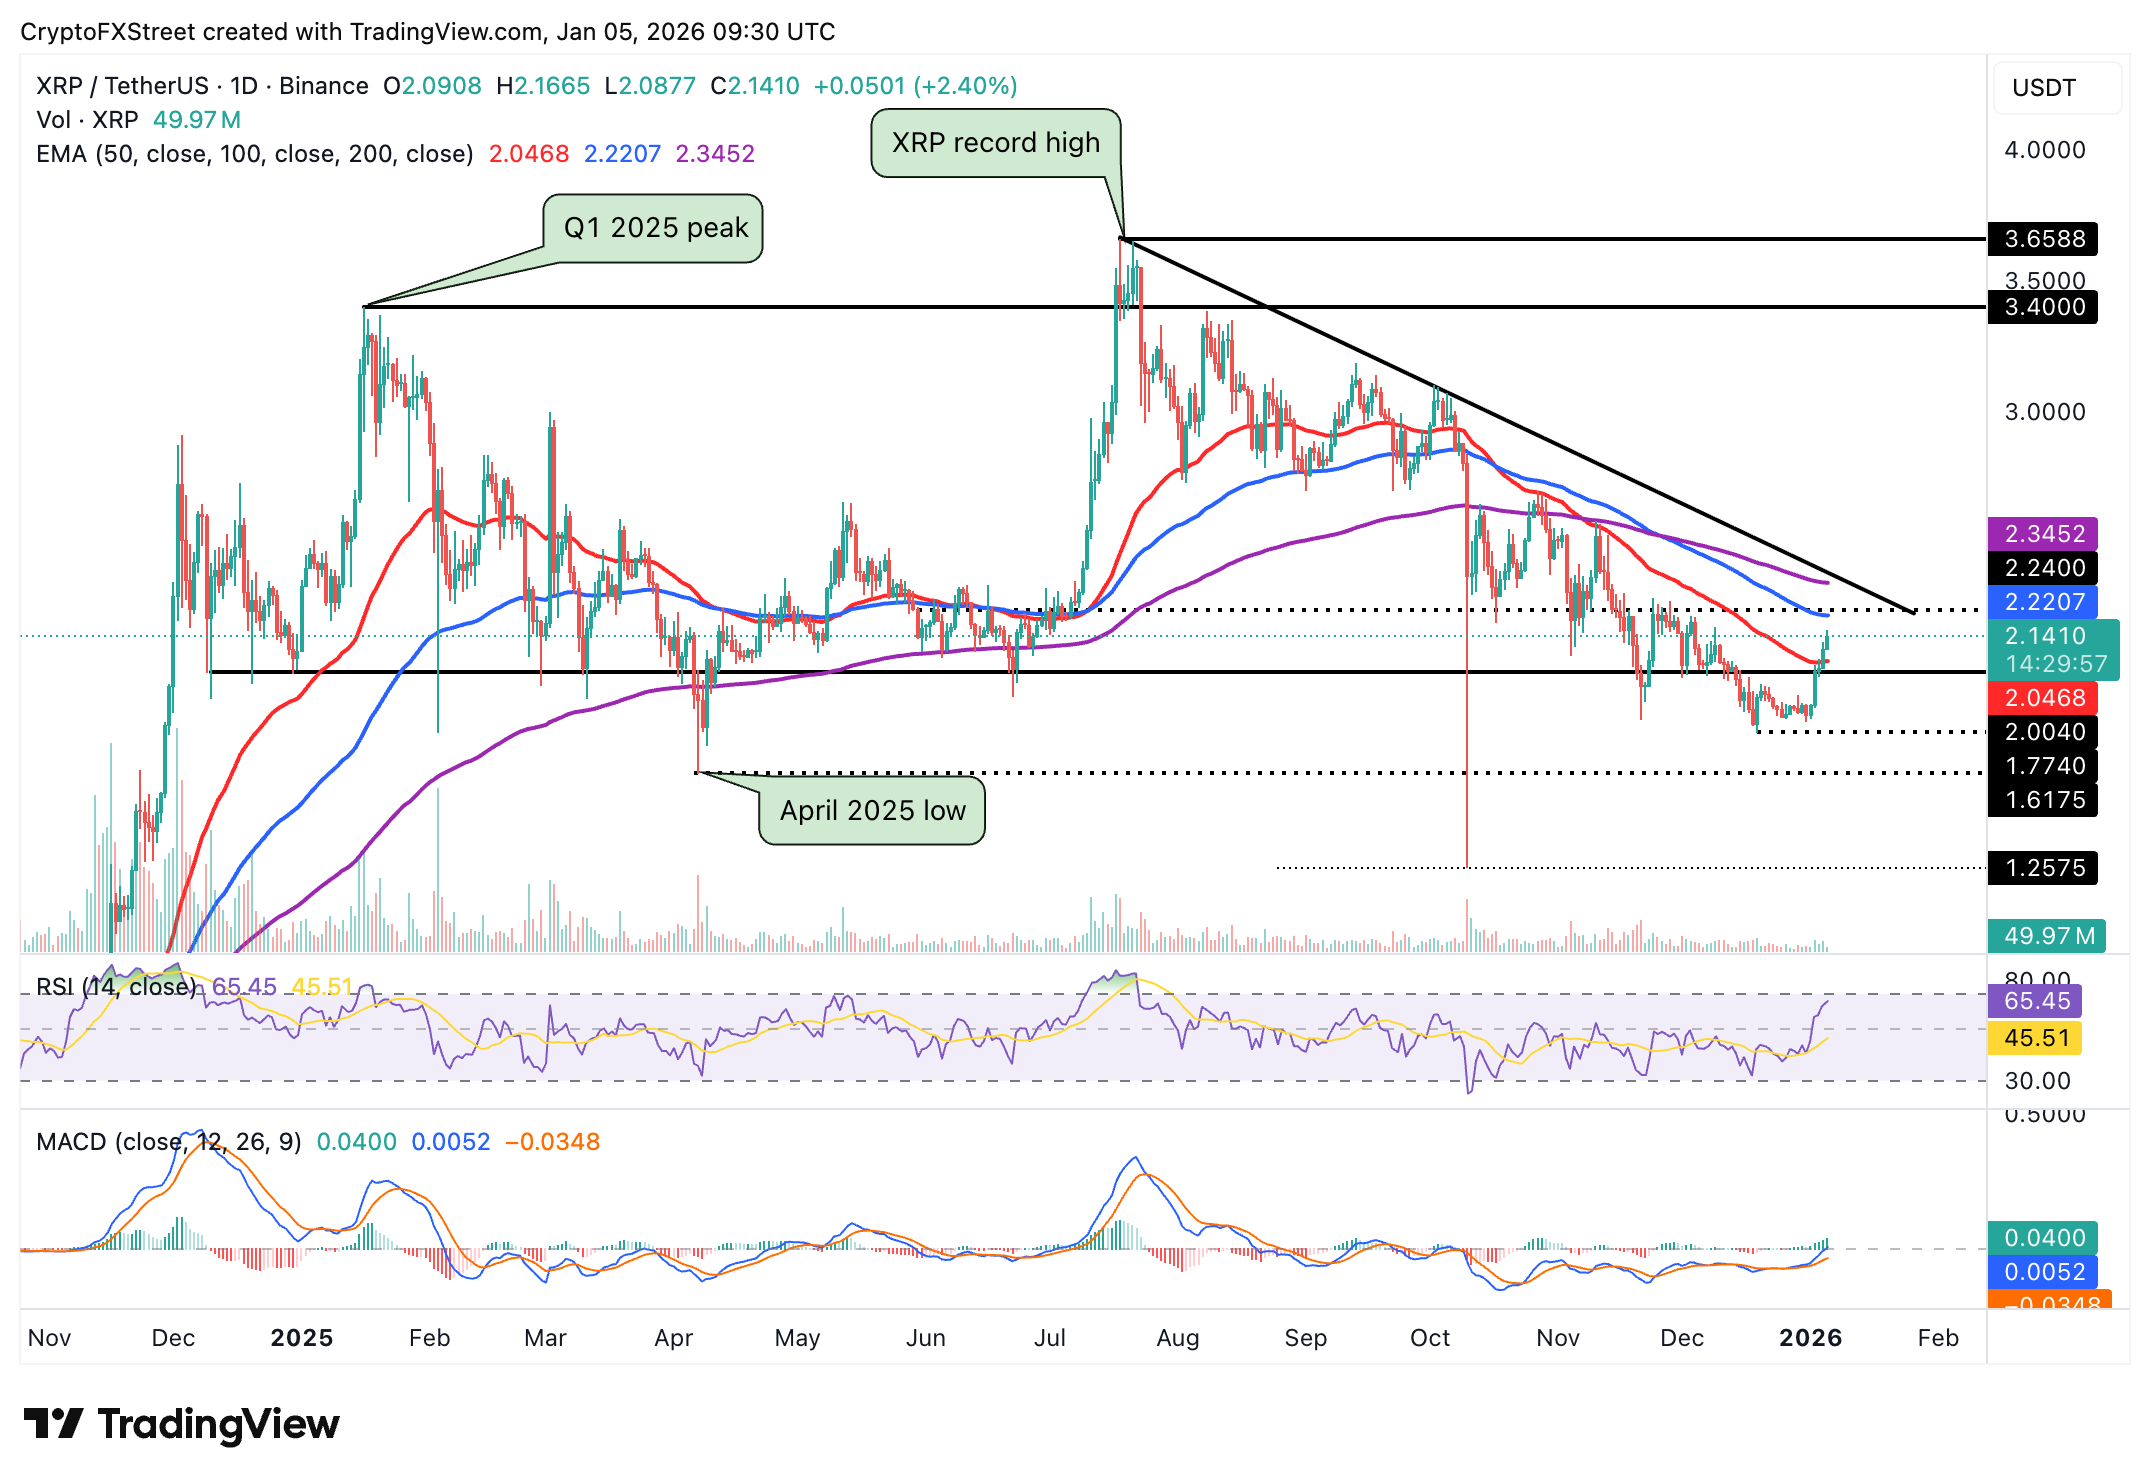
Key milestones include a break above the 100-day EMA at $2.22 and the 200-day EMA at $2.35. A close past the moving average cluster and by extension, the descending trendline, would reinforce the bullish outlook.
Still, closing below the 50-day EMA may increase the odds of another drop below the pivotal $2.00 level.
Crypto ETF FAQs
An Exchange-Traded Fund (ETF) is an investment vehicle or an index that tracks the price of an underlying asset. ETFs can not only track a single asset, but a group of assets and sectors. For example, a Bitcoin ETF tracks Bitcoin’s price. ETF is a tool used by investors to gain exposure to a certain asset.
Yes. The first Bitcoin futures ETF in the US was approved by the US Securities & Exchange Commission in October 2021. A total of seven Bitcoin futures ETFs have been approved, with more than 20 still waiting for the regulator’s permission. The SEC says that the cryptocurrency industry is new and subject to manipulation, which is why it has been delaying crypto-related futures ETFs for the last few years.
Yes. The SEC approved in January 2024 the listing and trading of several Bitcoin spot Exchange-Traded Funds, opening the door to institutional capital and mainstream investors to trade the main crypto currency. The decision was hailed by the industry as a game changer.
The main advantage of crypto ETFs is the possibility of gaining exposure to a cryptocurrency without ownership, reducing the risk and cost of holding the asset. Other pros are a lower learning curve and higher security for investors since ETFs take charge of securing the underlying asset holdings. As for the main drawbacks, the main one is that as an investor you can’t have direct ownership of the asset, or, as they say in crypto, “not your keys, not your coins.” Other disadvantages are higher costs associated with holding crypto since ETFs charge fees for active management. Finally, even though investing in ETFs reduces the risk of holding an asset, price swings in the underlying cryptocurrency are likely to be reflected in the investment vehicle too.
Bài viết đề xuất


