
Top 3 Price Prediction: Bitcoin, Ethereum, Ripple – BTC, ETH, and XRP consolidate after recent market correction
- Bitcoin price hovers around $101,500 on Wednesday, finding support near a crucial level following a sharp correction.
- Ethereum price steadies around $3,320, retesting the daily support zone around $3,171 as selling pressure eases.
- XRP hovers around $2.22 after falling more than 11% so far this week.
Bitcoin (BTC), Ethereum (ETH), and Ripple (XRP) are showing signs of stabilization on Wednesday after a sharp market-wide correction earlier in the week. These top three cryptocurrencies are consolidating near key support levels, suggesting traders are reassessing their next moves amid easing volatility.
Bitcoin finds support around the $100,353 support level
Bitcoin price faced rejection around its previously broken trendline on Monday and declined 8.18% until the next day, retesting the 50% retracement level at $100,353. At the time of writing on Wednesday, BTC is finding support around $100,353 and trading slightly above $102,000.
If the 50% retracement level at $100,353 continues to hold as support, BTC could extend its recovery toward the next key resistance level at $106,435.
The Relative Strength Index (RSI) is 33, hovering near oversold territory, suggesting that selling momentum may be easing and that a potential short-term rebound could be on the horizon.
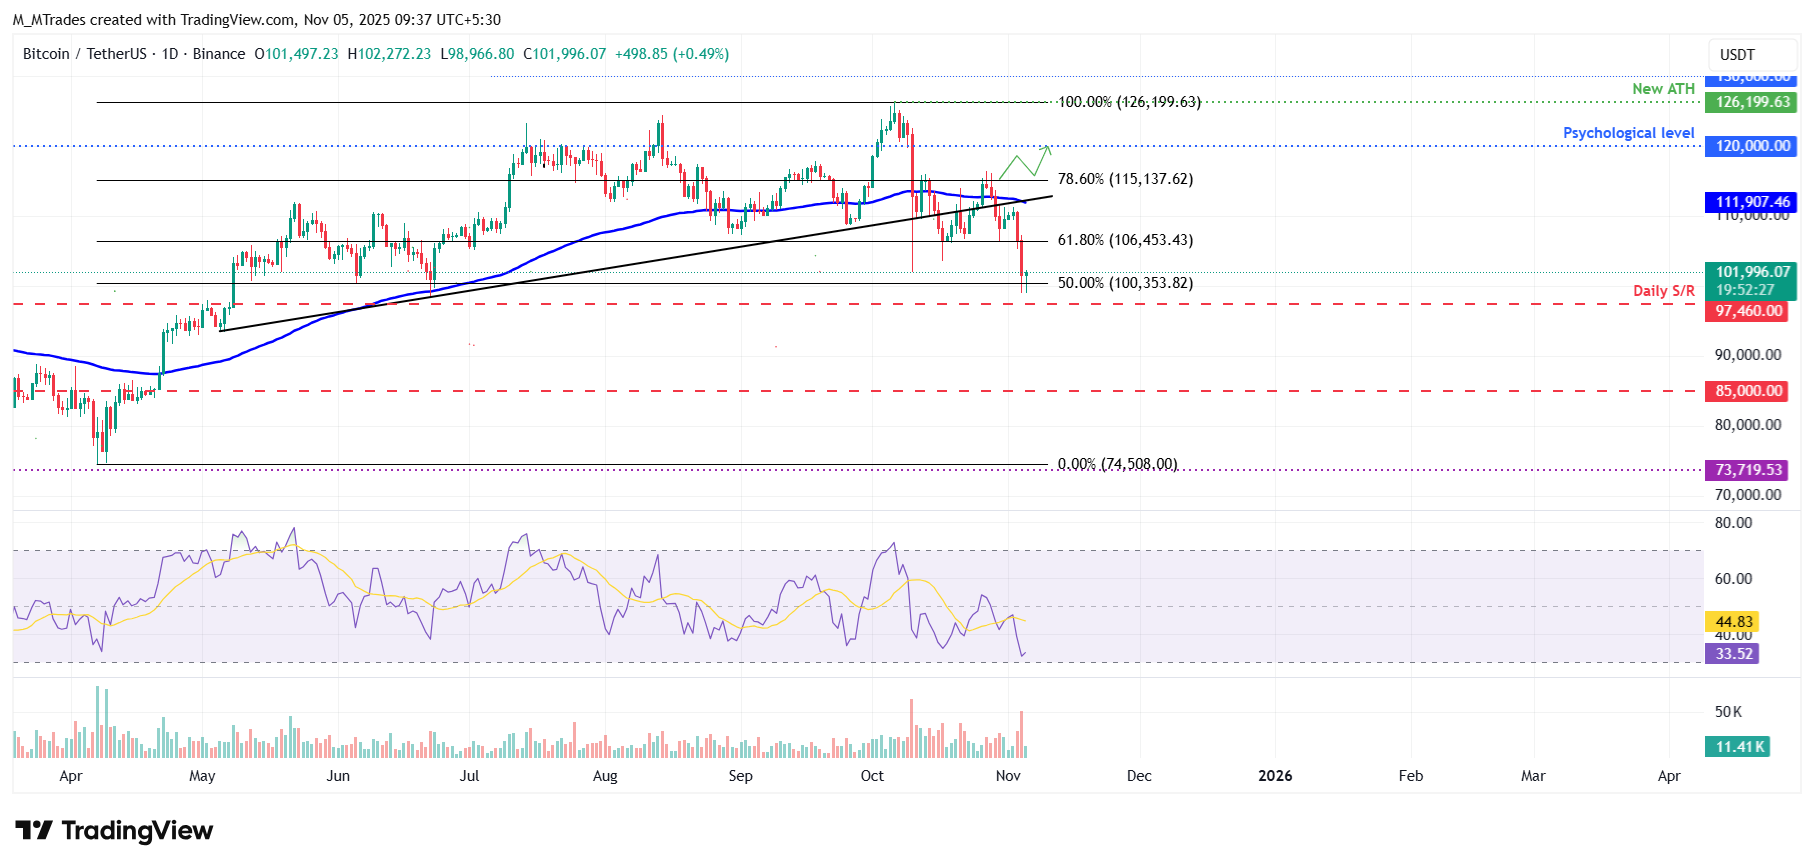
On the other hand, if BTC closes below the $100,353 support level, it could extend the decline toward the next daily support at $97,460.
Ethereum could rebound after retesting key support at $3,171
Ethereum price faced rejection from the 100-day EMA at $3,928 on Monday and declined by 15.73% the next day. At the time of writing on Wednesday, ETH rebounds slightly after retesting the 50% retracement level at $3,171.
If the $3,171 continues to hold as support, ETH could extend the recovery toward the 61.8% Fibonacci retracement level at $3,593.
The Relative Strength Index (RSI) reads 31 and points upwards after retesting oversold territory, indicating that selling momentum may be easing and a potential short-term rebound could be on the horizon.
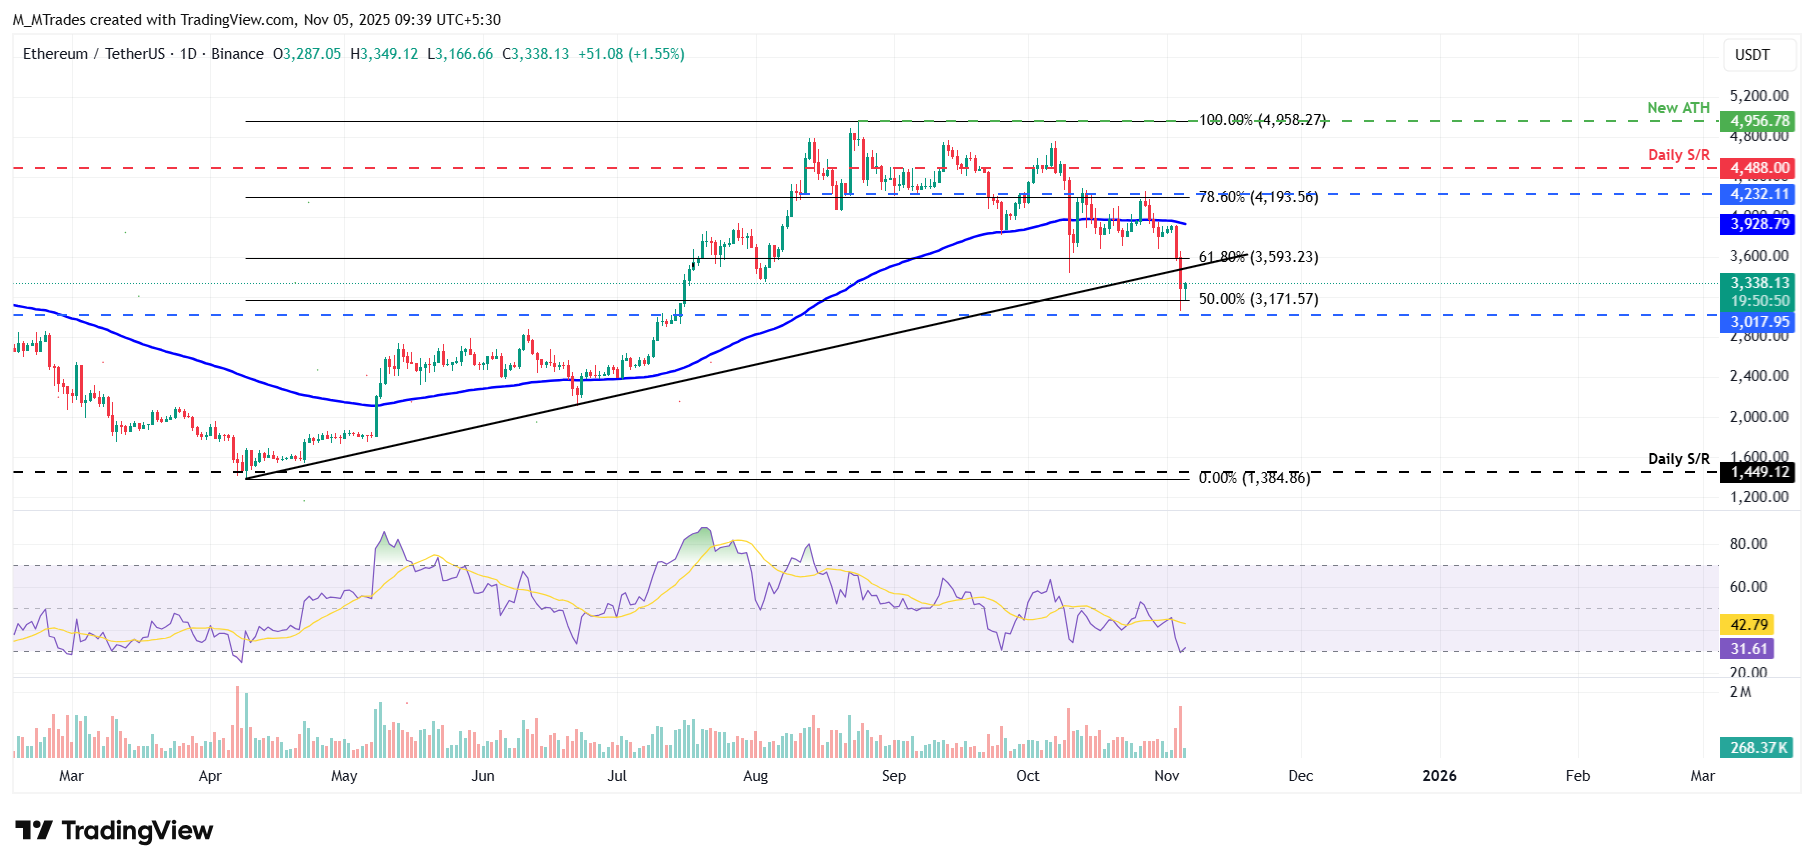
However, if ETH closes below $3,171, it could extend the decline toward the next daily support at $3,017.
XRP could recover if the $2.35 level holds as support
XRP price started the week on a negative note, declining by more than 12% through Tuesday after being rejected around the 50-day EMA at $2.60 on Monday. At the time of writing on Wednesday, XRP hovers at around $2.24.
If the daily support at $2.35 holds, XRP could extend the recovery toward the 50-day EMA at $2.60.
Like Bitcoin and Ethereum, XRP RSI indicates that selling momentum is starting to ease, suggesting a potential short-term rebound may be on the horizon.
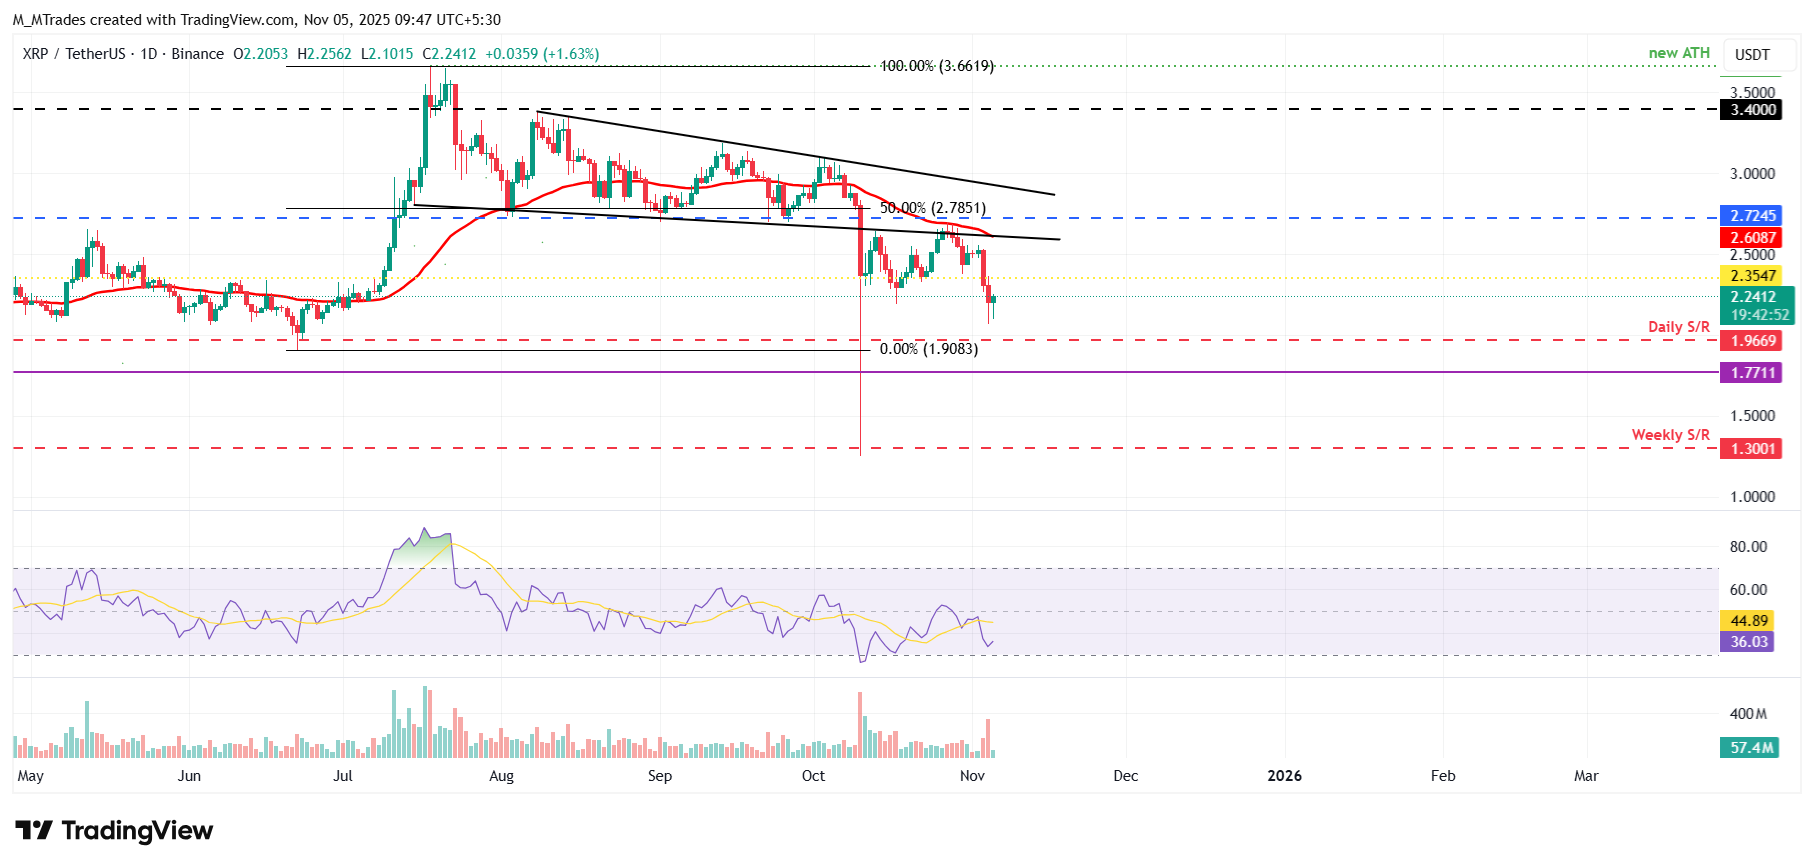
However, if XRP closes below $2.35, it could extend the decline toward the next daily support at $1.96.
Cryptocurrency metrics FAQs
The developer or creator of each cryptocurrency decides on the total number of tokens that can be minted or issued. Only a certain number of these assets can be minted by mining, staking or other mechanisms. This is defined by the algorithm of the underlying blockchain technology. On the other hand, circulating supply can also be decreased via actions such as burning tokens, or mistakenly sending assets to addresses of other incompatible blockchains.
Market capitalization is the result of multiplying the circulating supply of a certain asset by the asset’s current market value.
Trading volume refers to the total number of tokens for a specific asset that has been transacted or exchanged between buyers and sellers within set trading hours, for example, 24 hours. It is used to gauge market sentiment, this metric combines all volumes on centralized exchanges and decentralized exchanges. Increasing trading volume often denotes the demand for a certain asset as more people are buying and selling the cryptocurrency.
Funding rates are a concept designed to encourage traders to take positions and ensure perpetual contract prices match spot markets. It defines a mechanism by exchanges to ensure that future prices and index prices periodic payments regularly converge. When the funding rate is positive, the price of the perpetual contract is higher than the mark price. This means traders who are bullish and have opened long positions pay traders who are in short positions. On the other hand, a negative funding rate means perpetual prices are below the mark price, and hence traders with short positions pay traders who have opened long positions.
Bài viết đề xuất


