
Bitcoin Price Forecast: BTC falls below $108,000 amid economic uncertainty, ETF outflows
- Bitcoin price trades in red on Tuesday after rejection from a previously broken trendline.
- The prolonged US government shutdown and US-China trade uncertainty continue to weigh on riskier assets.
- US-listed spot Bitcoin ETFs record $40.47 million outflows on Monday, following the second-largest weekly withdrawal since launch last week.
Bitcoin (BTC) price trades below $108,000 at the time on Tuesday, after facing rejection from a previously broken trendline, signaling renewed selling pressure. Broader risk appetite continues to weaken amid the ongoing US government shutdown and headlines about US-China trade dispute. Meanwhile, spot Bitcoin Exchange Traded Funds (ETFs) saw continued outflows, reflecting cautious institutional positioning.
US government shutdown and US-China trade tensions continue to pressure riskier assets
Bitcoin started the week on a positive note, reclaiming the $111,000 level on Monday and closing the day with 1.74% gains. However, those gains were quickly erased at the time of writing on Tuesday, as BTC corrected lower to trade below $108,000.
Market participants seem worried that a prolonged US government closure would affect the economic performance. The Senate voted against reopening the US government for the 11th time on Monday, extending the shutdown to its third week as both sides (Republicans and Democrats) remain deadlocked.
However, White House economic advisor Kevin Hassett said on Monday that the government shutdown is “likely to end sometime this week,” in an interview with CNBC.
Hassett continued, “If that does not happen, the Trump administration may impose 'stronger measures' to force Democrats to cooperate.”
Moreover, on Sunday, US President Donald Trump stated that the US and China would strike a fantastic deal, but warned that failure to do so could result in tariffs of up to 155% on Chinese goods. This keeps focus squarely on more US-China trade talks next week.
The ongoing US government shutdown and uncertainty surrounding the US-China trade deal are keeping a lid on riskier assets such as Bitcoin.
Institutional demand continues to weaken
Bitcoin institutional demand continues to weaken as the week begins. According to SoSoValue data (chart below), Bitcoin spot ETFs recorded an outflow of $40.47 million on Monday, continuing the four-day streak of outflows since mid-October. This follows the second-largest weekly outflow since the ETFs’ launch last week, underscoring cautious investor sentiment.
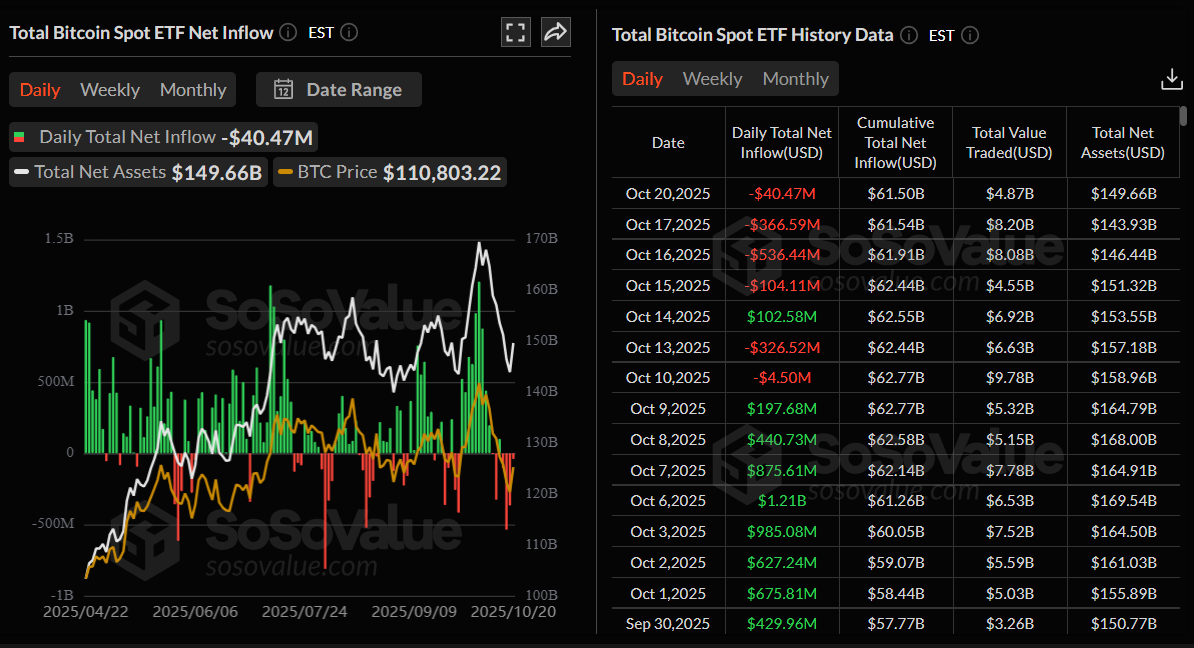
Total Bitcoin Spot ETF net inflow daily chart. Source: SoSoValue
Expert view on Bitcoin's current conditions
In an exclusive interview with Fadi Aboualfa, Head of Research at Copper, regarding his view on current market conditions.
Q1: How significant are the US-China trade tensions in influencing Bitcoin’s current price behavior?
It's largely headline risk rather than policy substance driving price action. We haven't seen actual trade measures materialize since the threatened 100% tariff on Chinese imports. The key tell is that Bitcoin's moves are mirroring traditional risk assets: equities shed nearly $2 trillion over the same window that BTC corrected. This correlation indicates that Bitcoin is still trading as a macro risk-on asset, rather than moving independently of traditional markets during uncertainty.
Q:2 In your view, should investors approach this phase as an opportunity for gradual accumulation or remain on the sidelines amid macro uncertainty?
All investors are biting their nails – there are a lot of profits to be taken right now across the board, which means that some might view this as a free-carry opportunity for Bitcoin trading at its average price for the year. With Gold inflows running at twice Bitcoin’s and investors sitting on strong gains, there’s ample scope, and plenty of low-risk opportunities, for rotation into Bitcoin.
Q3: What is your price prediction for BTC for next week and the end of September?
$100,000 is the line in the sand this week; it aligns with the 52-week average and represents key structural support. Hold above it, and Bitcoin could push back toward $120,000-$125,000 by month-end, retracing most of the recent sell-off.
Bitcoin Price Forecast: BTC faces rejection from the previously broken trendline
Bitcoin price found support around the 61.8% Fibonacci retracement at $106,453 (drawn from the April low of $74,508 to the record high of $126,199) on Saturday and recovered by nearly 4% by Monday. At the time of writing on Tuesday, BTC trades down below $108,000, facing rejection from the previously broken trendline.
If BTC continues its correction, it could decline toward the 61.8% Fibonacci retracement at $106,453.
The Relative Strength Index (RSI) on the daily chart reads 40, below the neutral level of 50, indicating bearish momentum gaining traction. The Moving Average Convergence Divergence (MACD) also showed a bearish crossover last week, which remains in effect, further supporting the bearish view.
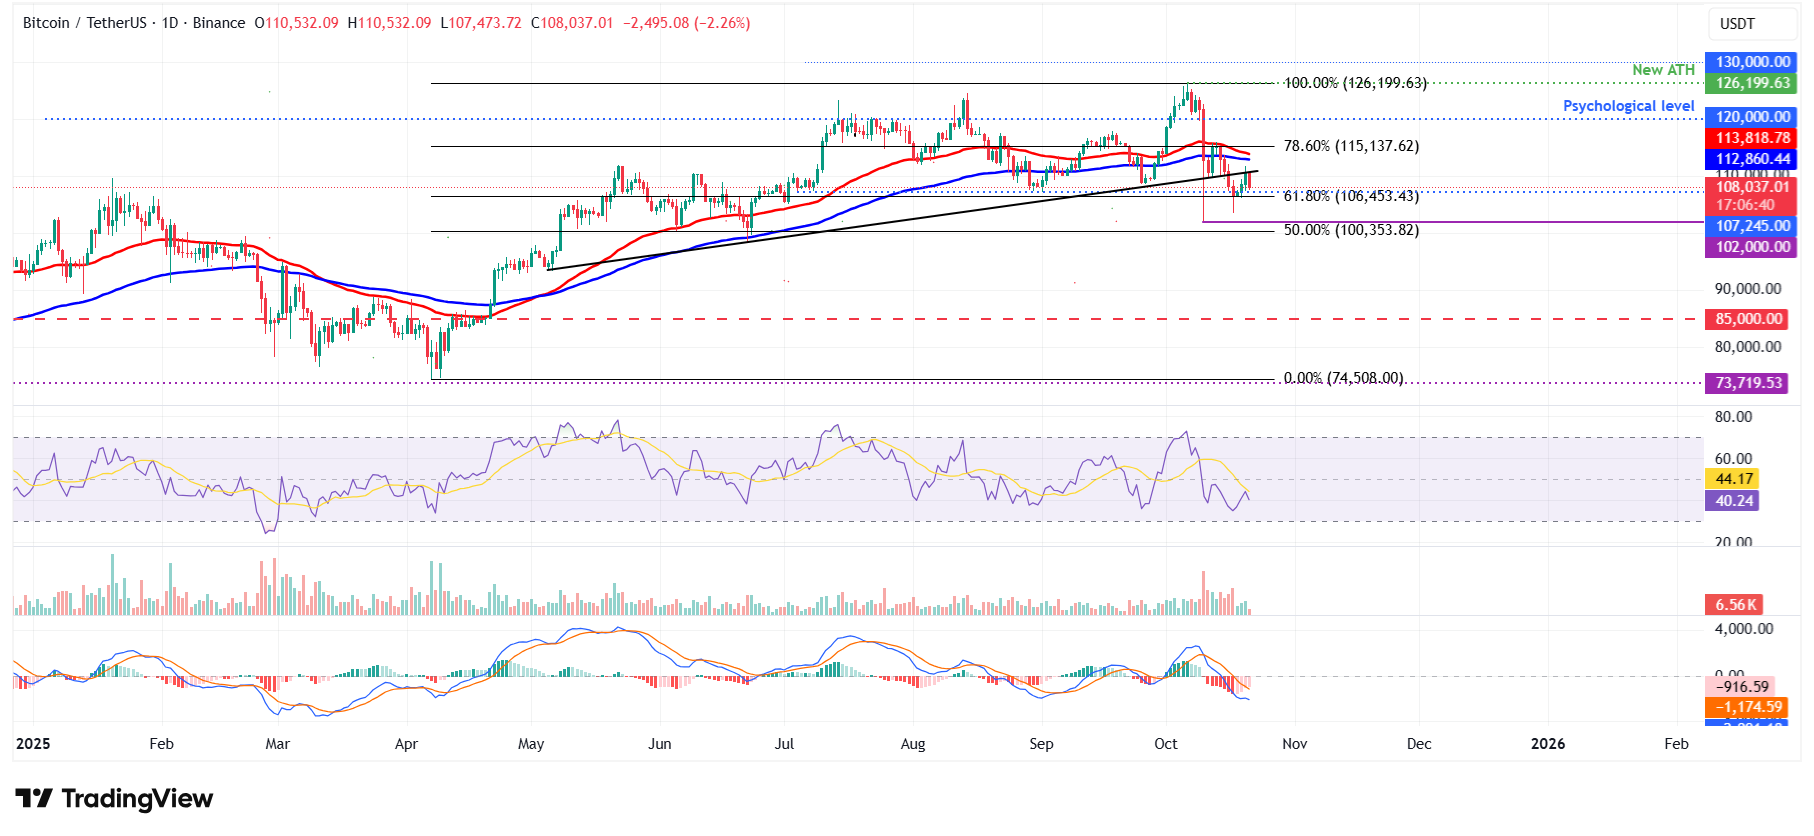
BTC/USDT daily chart
On the other hand, if BTC recovers and closes above the ascending trendline, it could extend the recovery toward the 50-day Exponential Moving Average (EMA) at $113,818.
Bài viết đề xuất


