Top Crypto Losers: Aster, PancakeSwap, and Immutable extend losses as Bitcoin revisits $110,000
- Aster records a double-digit decline in the last 24 hours, risking a drop to the $1 psychological support.
- PancakeSwap recovers slightly after a 13% fall on Wednesday, holding above the 50-day EMA.
- Immutable takes a bearish flip from the 100-day EMA, risking further losses below Friday’s support.
Aster (ASTER), PancakeSwap (CAKE), and Immutable (IMX) are among the worst-performing tokens over the last 24 hours at press time on Thursday, as the broader cryptocurrency market faces a second wave of supply dump. Bitcoin visited the $110,000 level earlier in the day after a 2% loss from the previous day, fueling the overhead pressure on altcoins.
Technically, the Binance-backed tokens ASTER and CAKE, alongside IMX, risk further losses as selling pressure resurfaces.
Bitcoin approaches a crucial crossroads
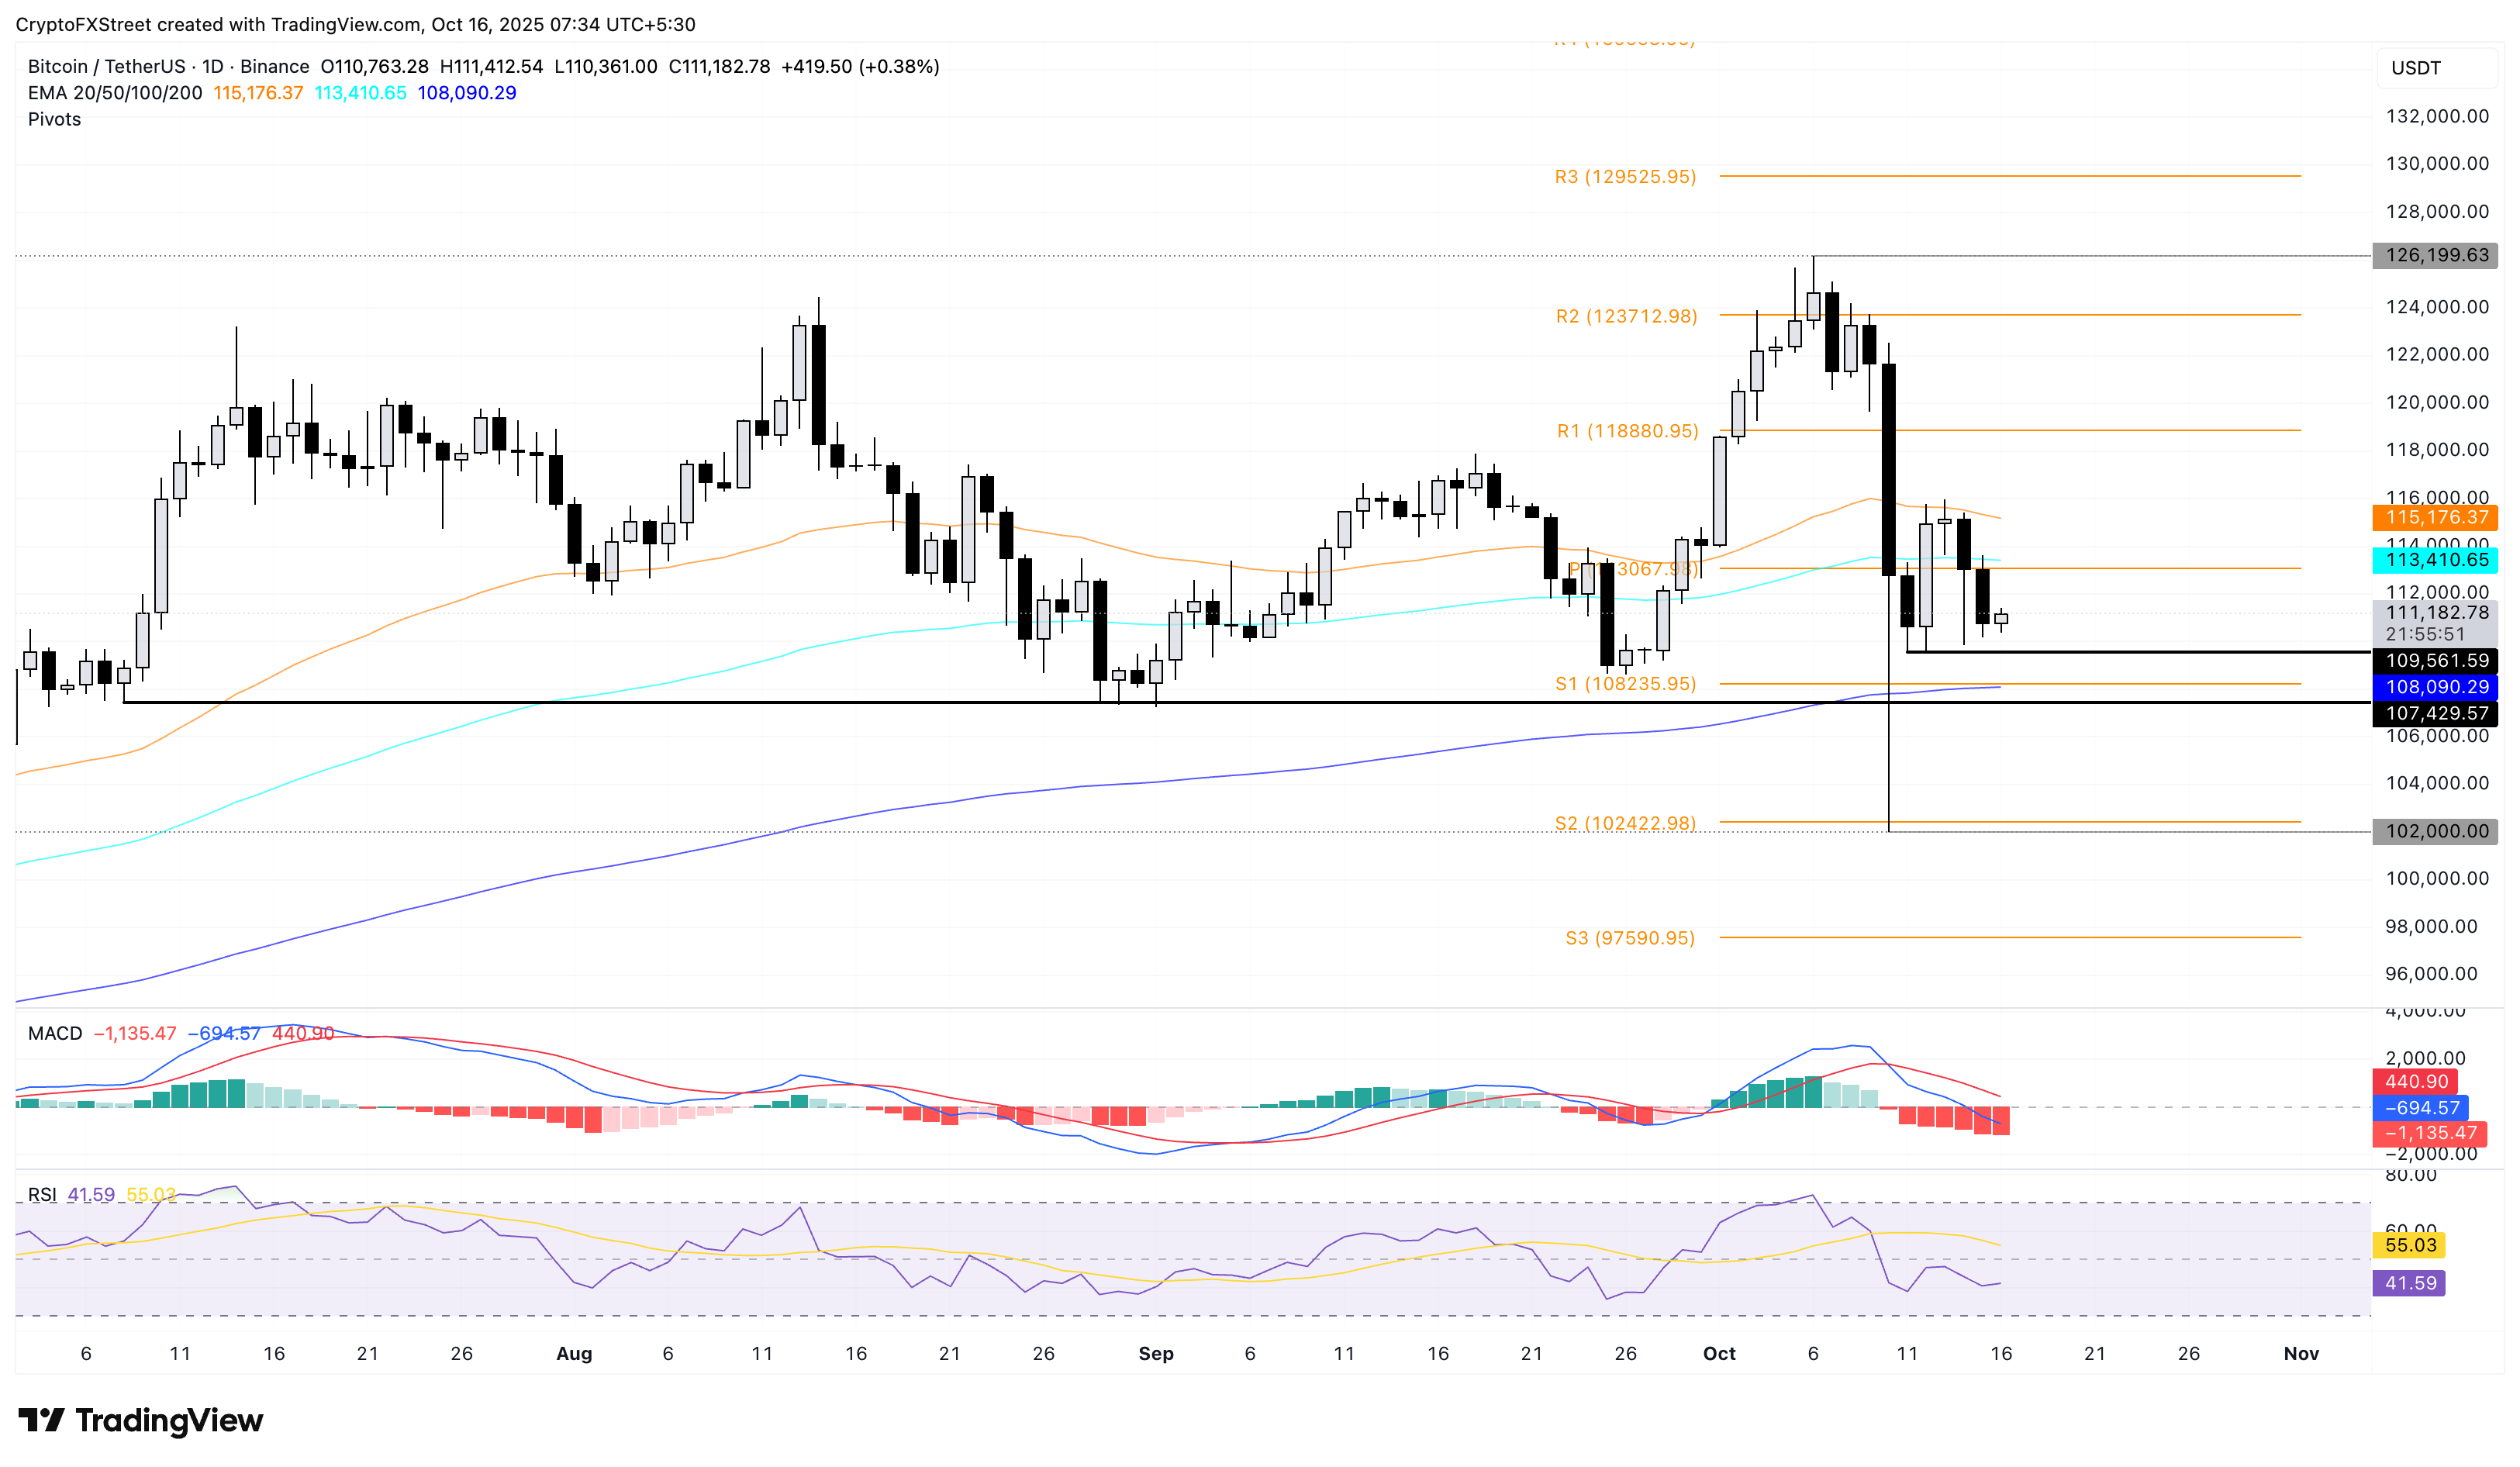
Bitcoin trades above $111,000 at the time of writing on Thursday, recovering from the $110,000 level visited earlier on the day. BTC holds steady after the two consecutive days of nearly 4% loss, erasing the 3.90% gains from Sunday.
The momentum indicators on the daily chart suggest that bearish momentum is increasing as the Moving Average Convergence Divergence (MACD) and its signal line extend the downfall with consecutive rises in bearish histograms.
Simultaneously, the Relative Strength Index (RSI) at 41 remains under bearish pressure, maintaining a sideways trend above the oversold zone.
If BTC extends the intraday recovery, it could test the 100-day Exponential Moving Average (EMA) at $113,416.

BTC/USDT daily price chart.
On the contrary, a drop below Saturday’s low at $109,561 could threaten the 200-day EMA at $108.093.
Aster risks extending the renewed pullback
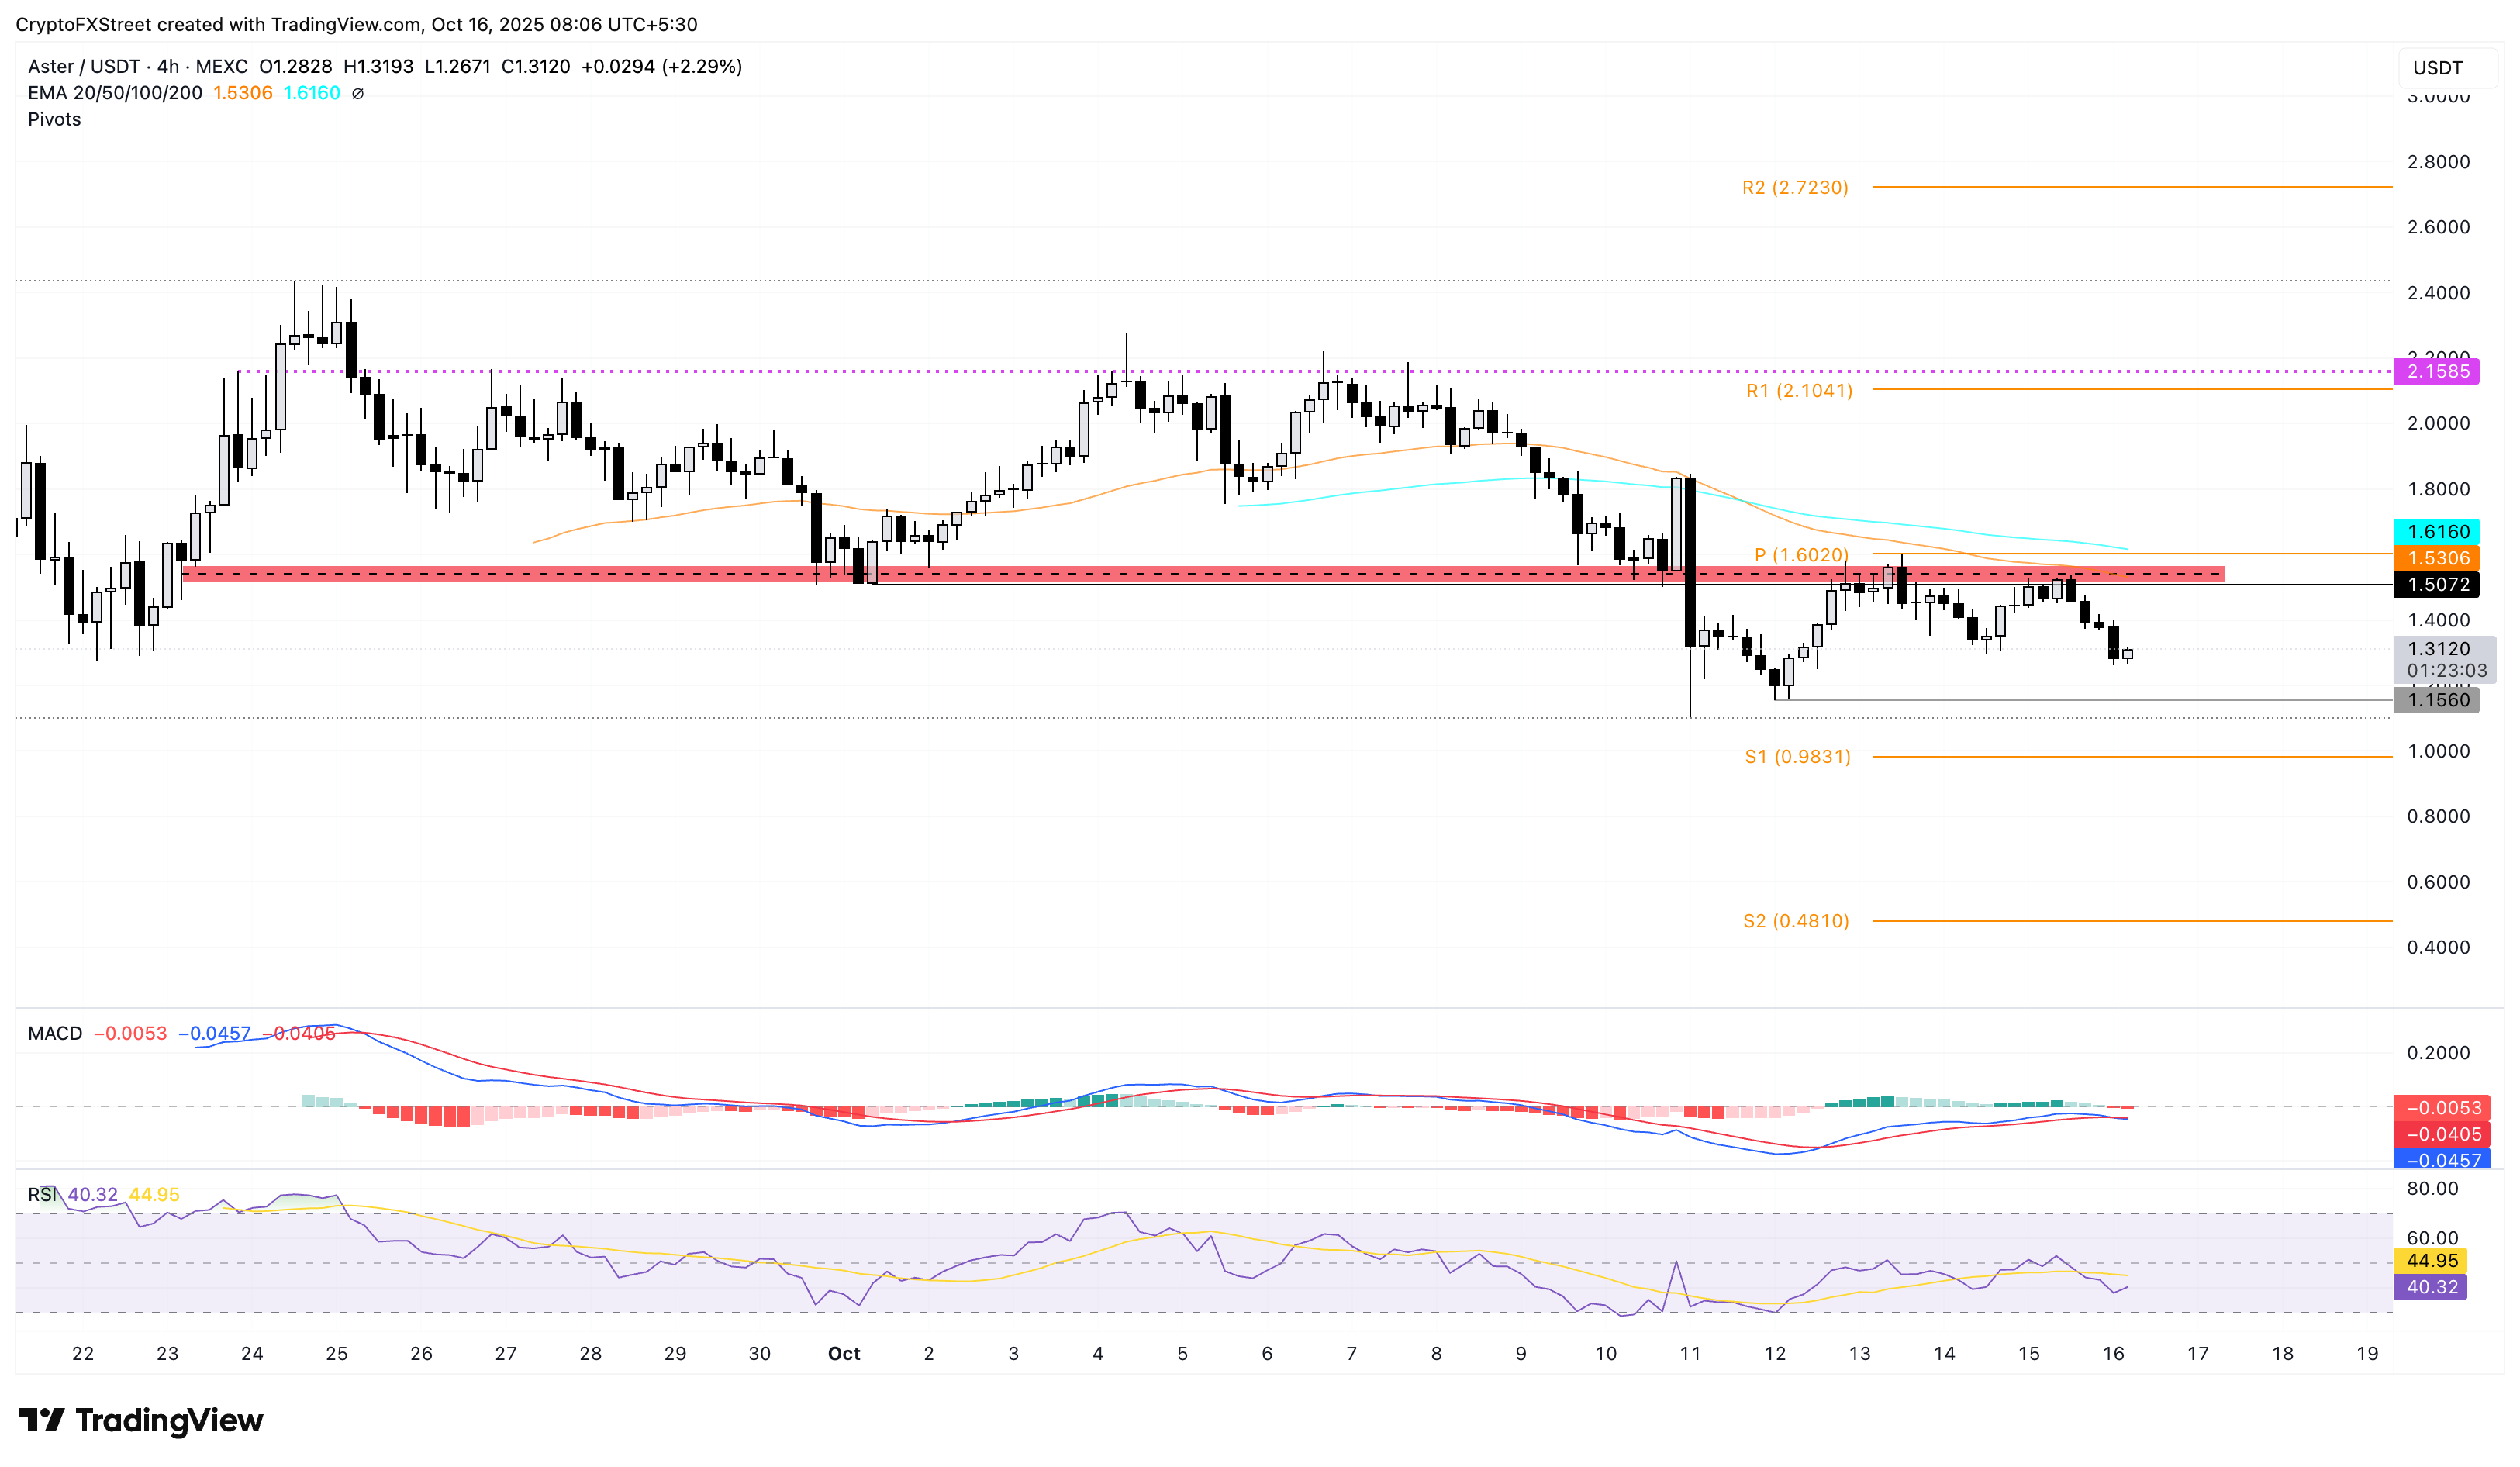
Aster trades at $1.30 at press time on Thursday, following the 14% decline from the previous day. The Binance-backed Perp Decentralized Exchange (DEX) token reversed from the $1.50 supply zone on the 4-hour chart, eyeing the $1.15 level from Sunday.
If ASTER extends the pullback below this level, it threatens the $1.00 psychological level and could test the S1 Pivot Point level at $0.98.
The technical indicators on the 4-hour chart suggest a negative shift in trend momentum as the MACD crosses below its signal line, indicating a rise in selling pressure.
Additionally, the RSI at 40 shows room for further correction before reaching the oversold zone.

ASTER/USDT 4-hour price chart.
Looking up, the $1.50 supply remains a crucial obstacle, and a clean push above this level could reach the R1 Pivot Point level at $2.10.
PancakeSwap finds solace at the 50-day EMA
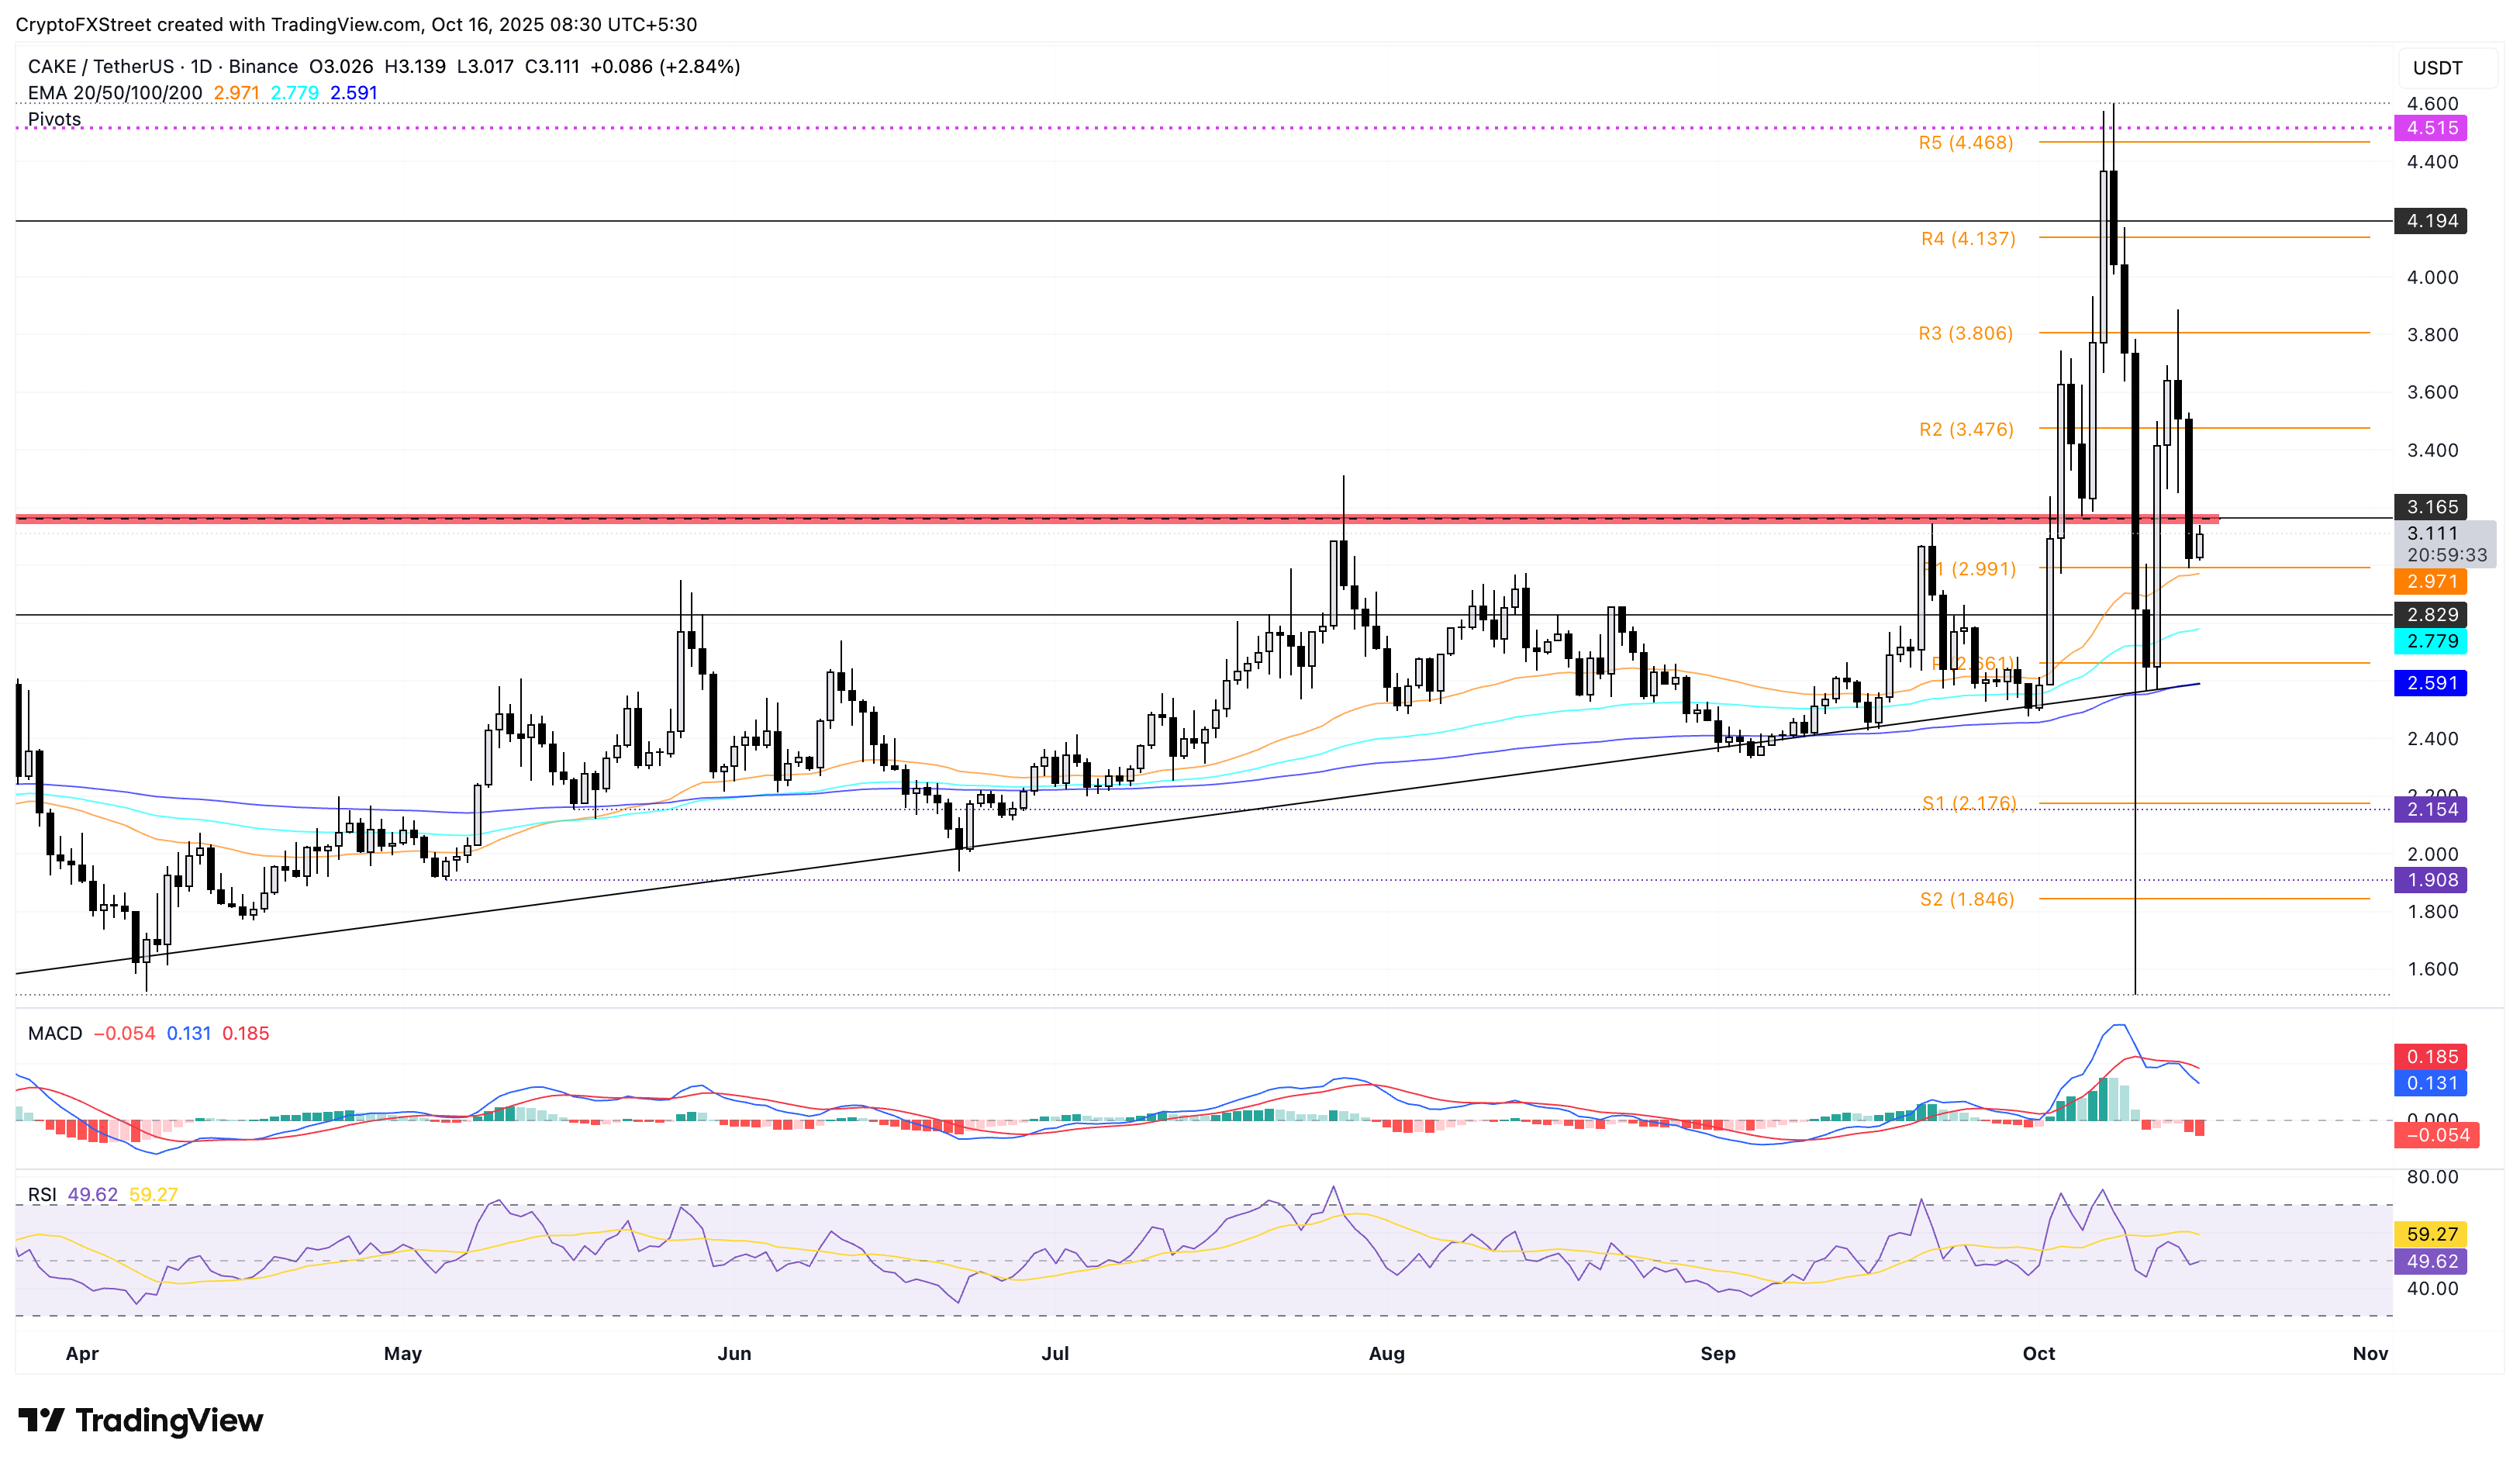
PancakeSwap edges higher by nearly 3% at the time of writing on Thursday, recovering after two consecutive days of losses. The DEX token holds above the 50-day EMA at $2.971, challenging the $3.165 level as the immediate resistance, which kept prices in check during the July and September rebounds.
If CAKE fails to hold above the 50-day EMA at $2.971, the 100-day and 200-day EMAs at $2.779 and $2.591, respectively, could act as support levels.
The MACD and signal lines on the daily chart are in a freefall after a crossover on Friday, indicating a steady rise in bearish momentum. At the same time, the RSI at 49 fluctuates near the halfway line after dropping from the overbought zone, suggesting a bearish incline.

CAKE/USDT daily price chart.
If CAKE surfaces above the $3.165 level, it could extend the recovery to the $3.476 mark, aligning with the R2 Pivot Point level.
Immutable flips from the 100-day EMA, risks further decline
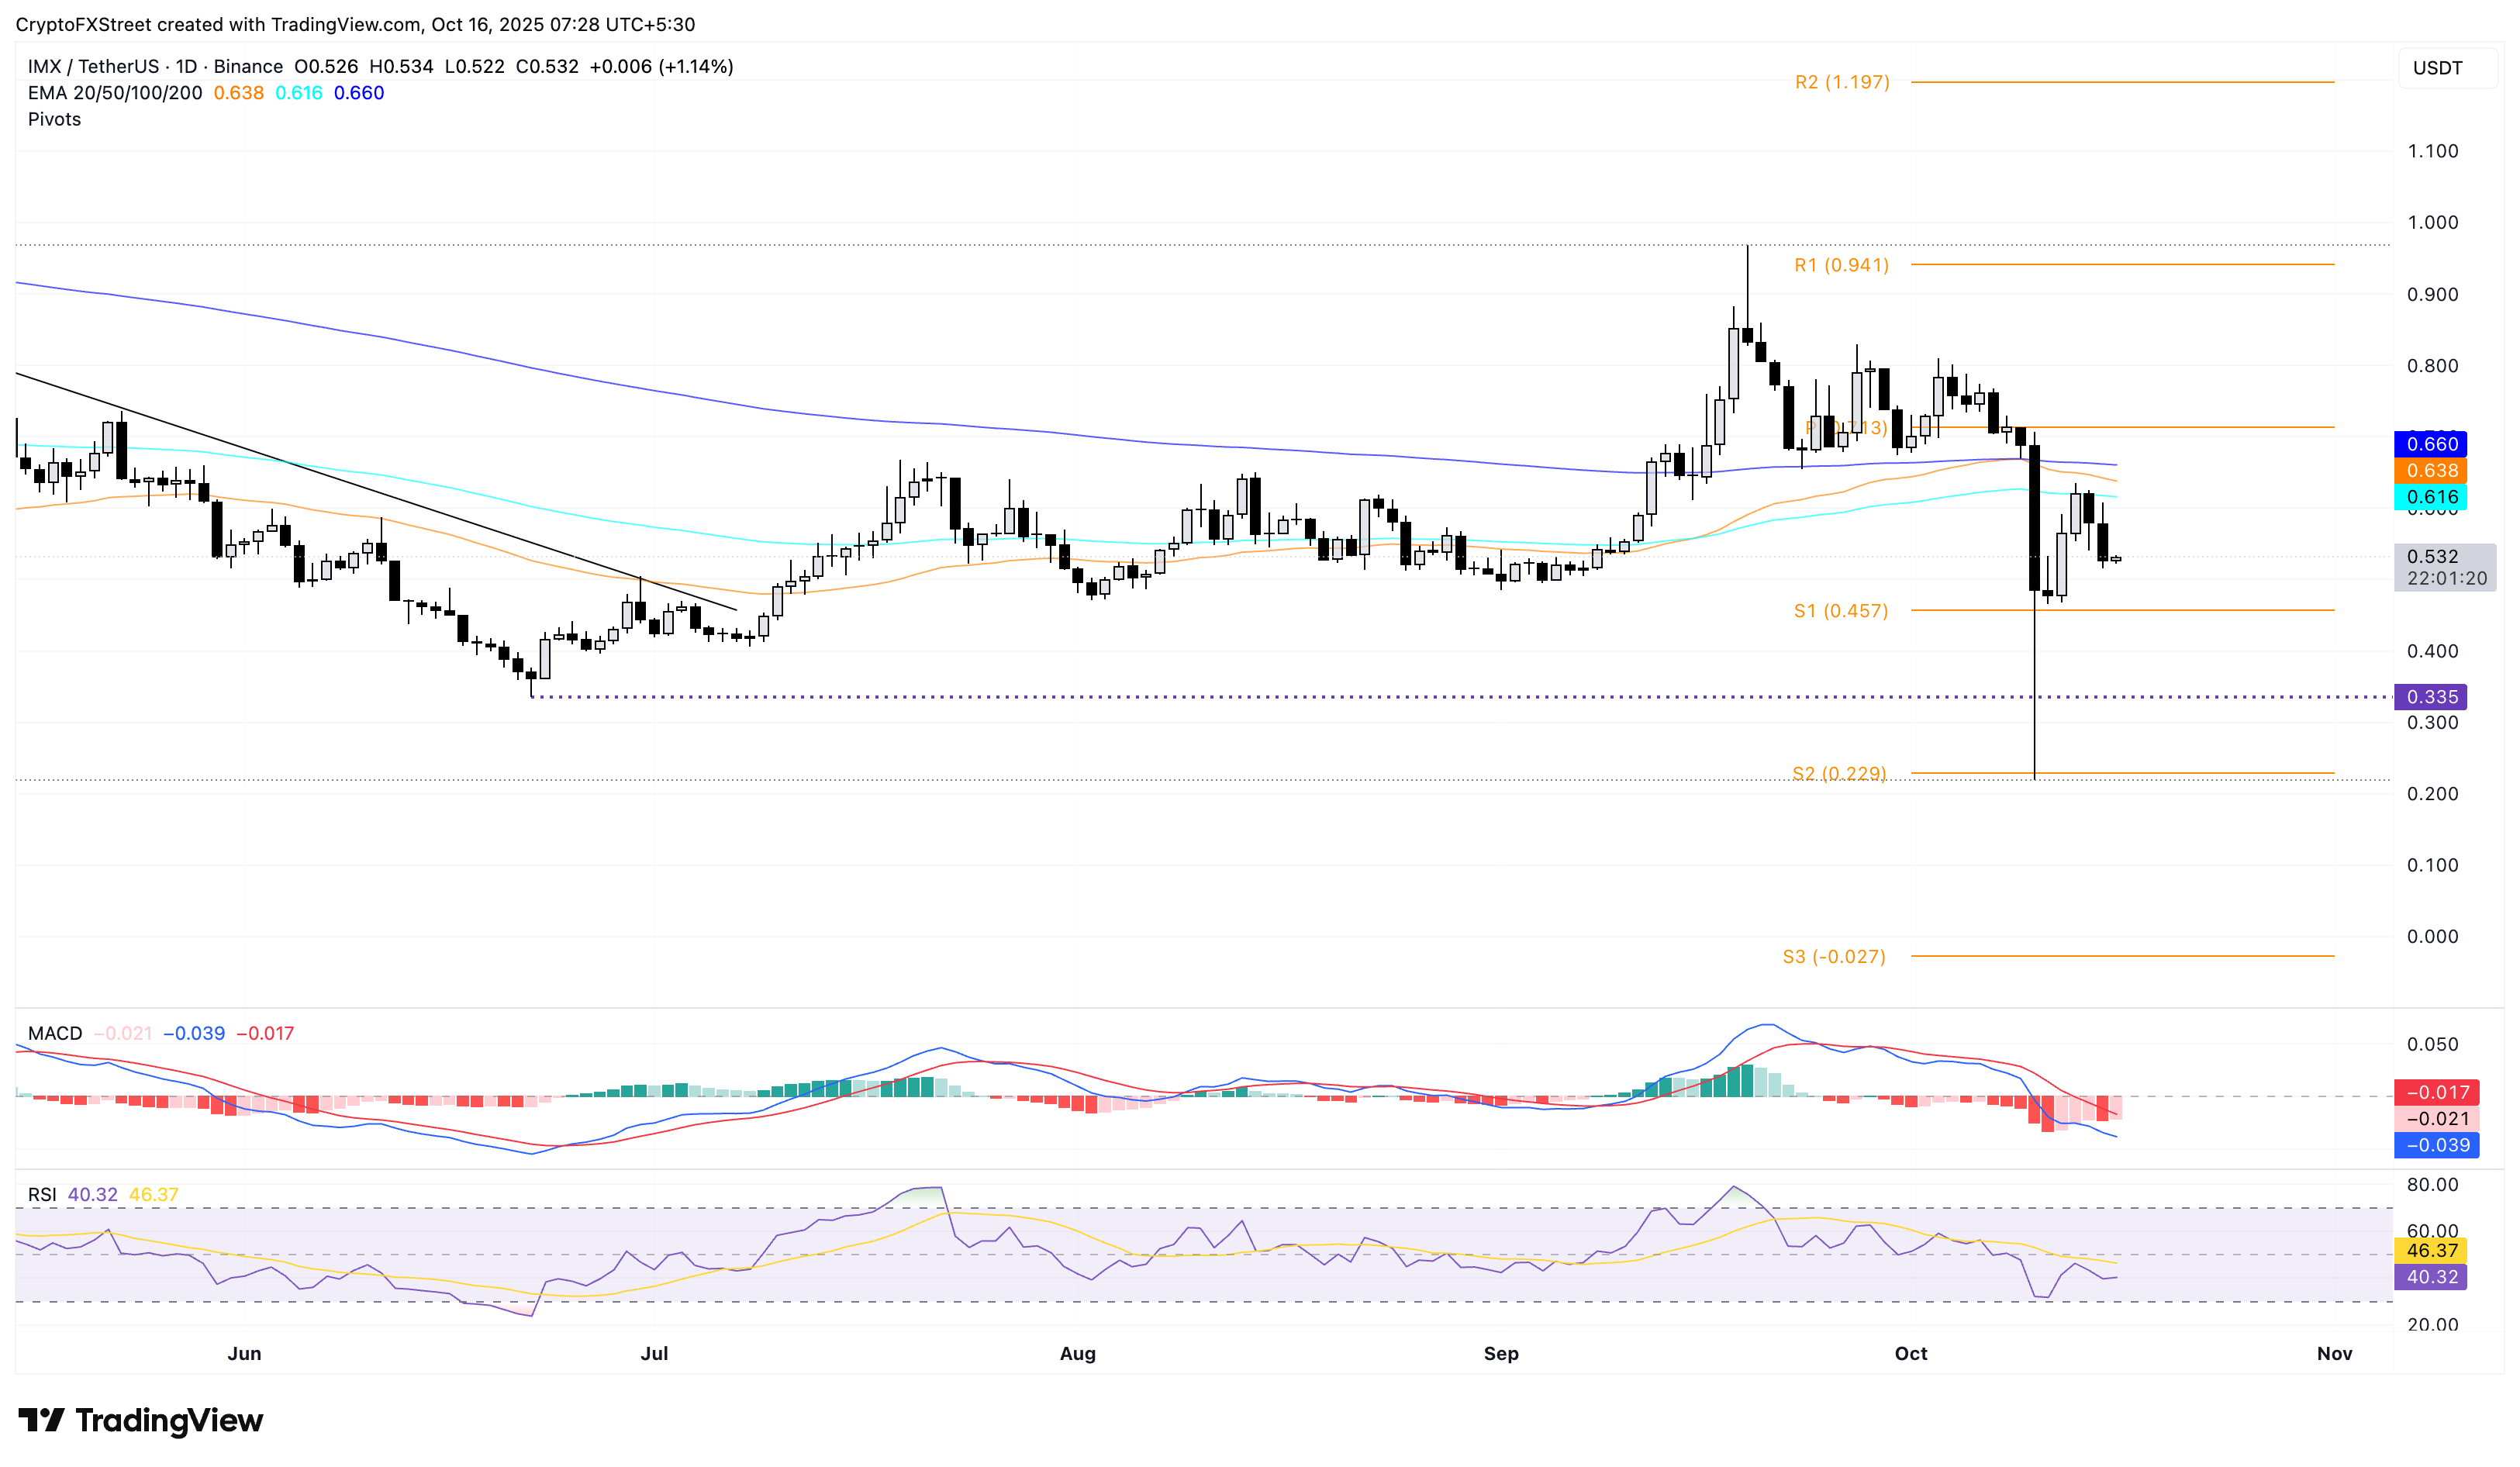
Immutable trades above $0.50 psychological mark at press time on Thursday, holding steady after the two-day pullback spree. The declining trend in the 50-day and 100-day EMAs risks a potential bearish cross, which could be considered a sell signal as the short-term decline gains traction.
The immediate support for IMX lies at the $0.457 mark, aligning with the S1 Pivot Point level.
The RSI at 40 extends the declining trend towards the oversold zone as selling pressure increases. Corroborating the rise in bearish power, the MACD advances a downward trend with its signal line below the zero-point mark, indicating a surge in bearish momentum.

IMX/USDT daily price chart.
If IMX manages a rebound, it could face the 100-day EMA at $0.616 as the immediate resistance.

