
Crypto Today: Bitcoin, Ethereum, XRP hold steady after a brief correction
- Bitcoin signals a potential rebound toward its record high, despite a minor drop in futures Open Interest.
- Ethereum defends short-term support at $4,400, supported by institutional demand via ETFs.
- XRP maintains a lower highs pattern as liquidations hit long position holders the hardest.
Bitcoin (BTC) regains momentum, trading above $122,000 on Wednesday, following a sharp pullback the previous day. Altcoins, including Ethereum (ETH) and Ripple (XRP), are holding steadily above key support levels, as bulls look forward to recouping the losses incurred on Tuesday.
Data spotlight: Bitcoin’s uptrend wobbles as Open Interest dips
Retail interest in Bitcoin has suffered a minor setback, with the futures Open Interest (OI) declining to $90.17 billion at the time of writing from $94.12 billion on Tuesday. OI is the notional value of outstanding futures contracts. Therefore, a correction implies that traders could be losing confidence in the uptrend and closing their long positions. A steady decline in the OI often signals the potential for an extended price correction.
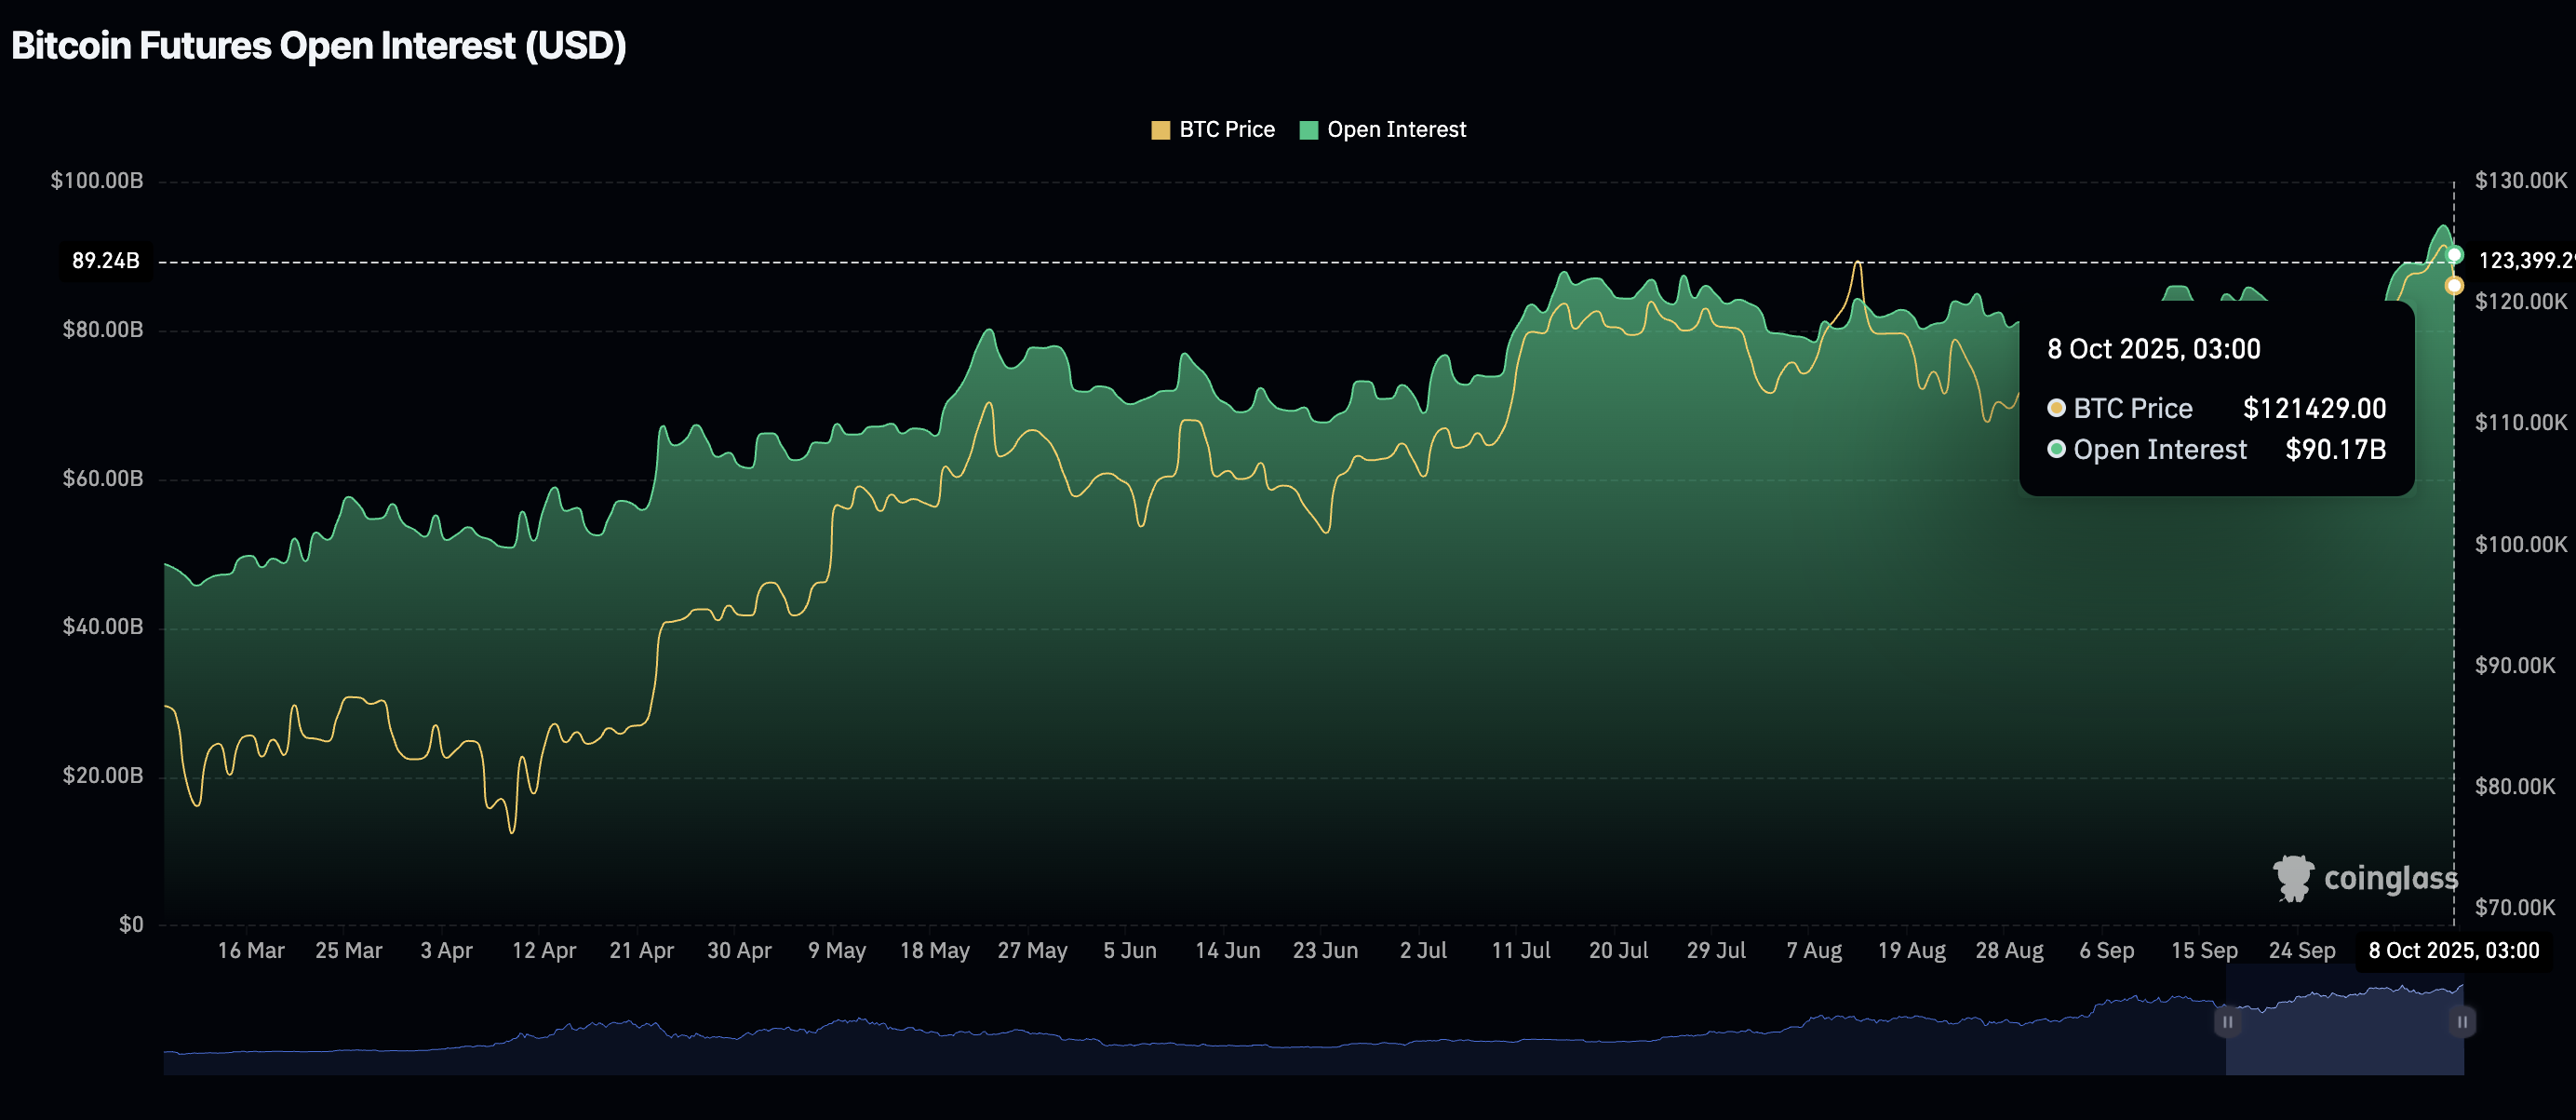
Bitcoin Futures Open Interest | Source: CoinGlass
Meanwhile, institutional interest in Ethereum remains at relatively elevated levels with spot Exchange Traded Funds (ETFs) experiencing inflows of $421 million on Tuesday.
According to SoSoValue data, ETH ETFs have experienced their seventh consecutive day of net inflows, underscoring growing interest in related digital investment products. The nine US ETH ETFs boast a cumulative total inflow of $15 billion with net assets averaging $30.86 billion.
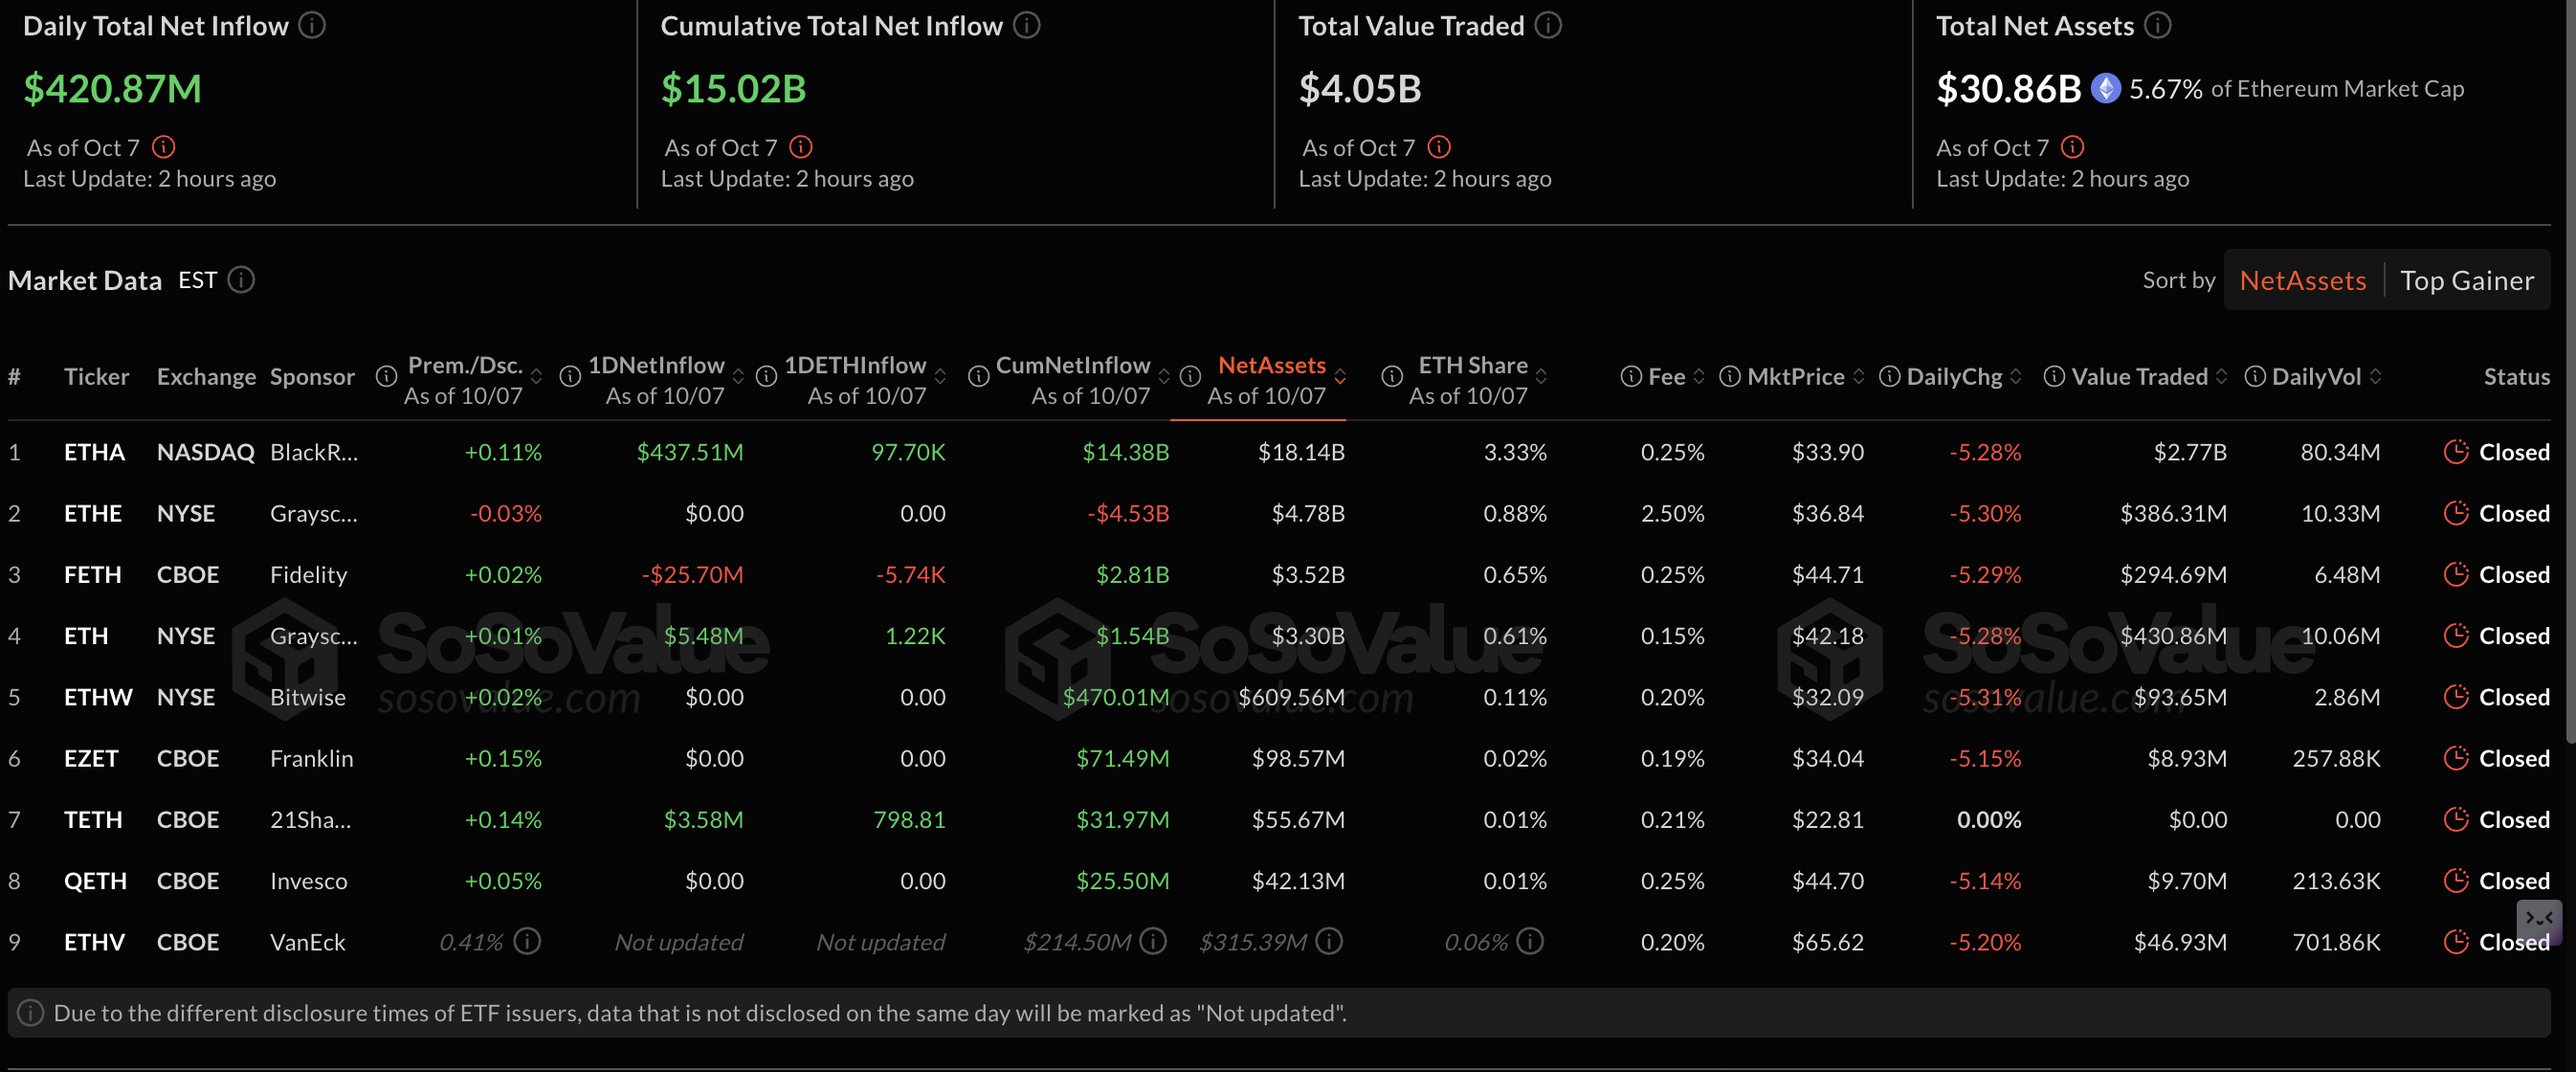
Ethereum ETF stats | Source: SoSoValue
As for XRP, the price correction on Tuesday left many traders, especially those in long positions, counting losses as liquidators surged. At least $21.17 million was wiped out in long positions compared to $2.17 million in shorts. As of the time of writing on Wednesday, long position liquidations have reached $3.38 million. In contrast, short positions have incurred losses of $178,050, indicating that traders were highly leveraged as they anticipated a sustained breakout above the $3.00 level.
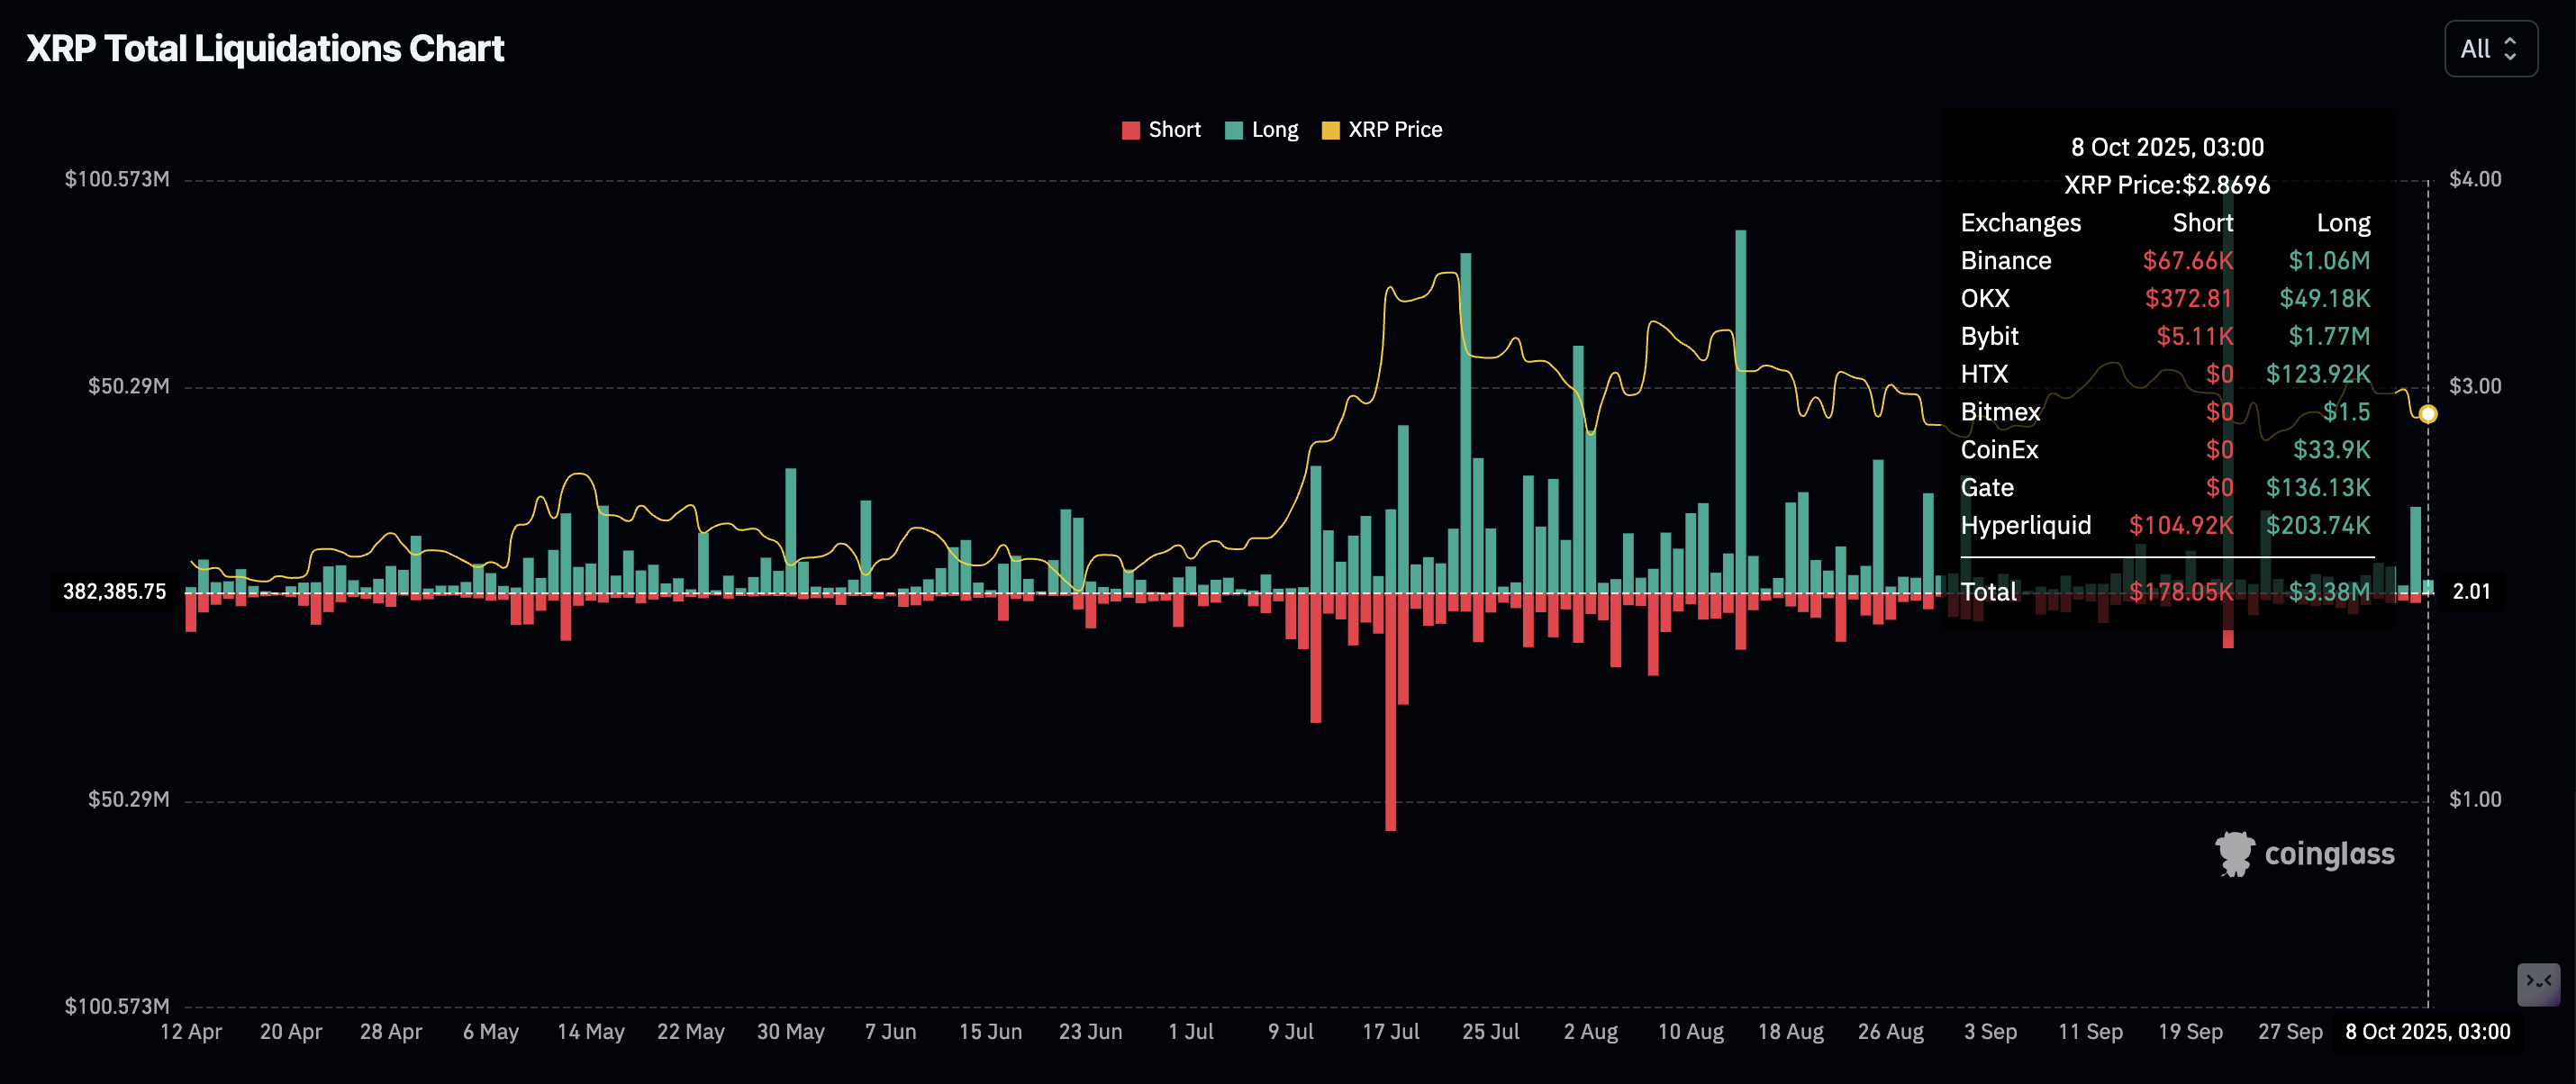
XRP Liquidations data | Source: CoinGlass
Chart of the day: Bitcoin bulls nurture short-term recovery
Bitcoin holds above $122,000 at the time of writing on Wednesday, marking a recovery after the previous day’s correction. Key technical indicators, such as the Moving Average Convergence Divergence (MACD) and the Relative Strength Index (RSI), reinforce BTC’s short-term bullish outlook on the daily chart.
The MACD indicator has maintained a buy signal since October 1, encouraging traders to increase risk exposure. Similarly, the RSI complements the buy signal, rising above 63.
A steady rebound toward overbought territory would indicate that buying pressure is increasing, which could help stabilize Bitcoin’s uptrend toward its record high of $126,199.
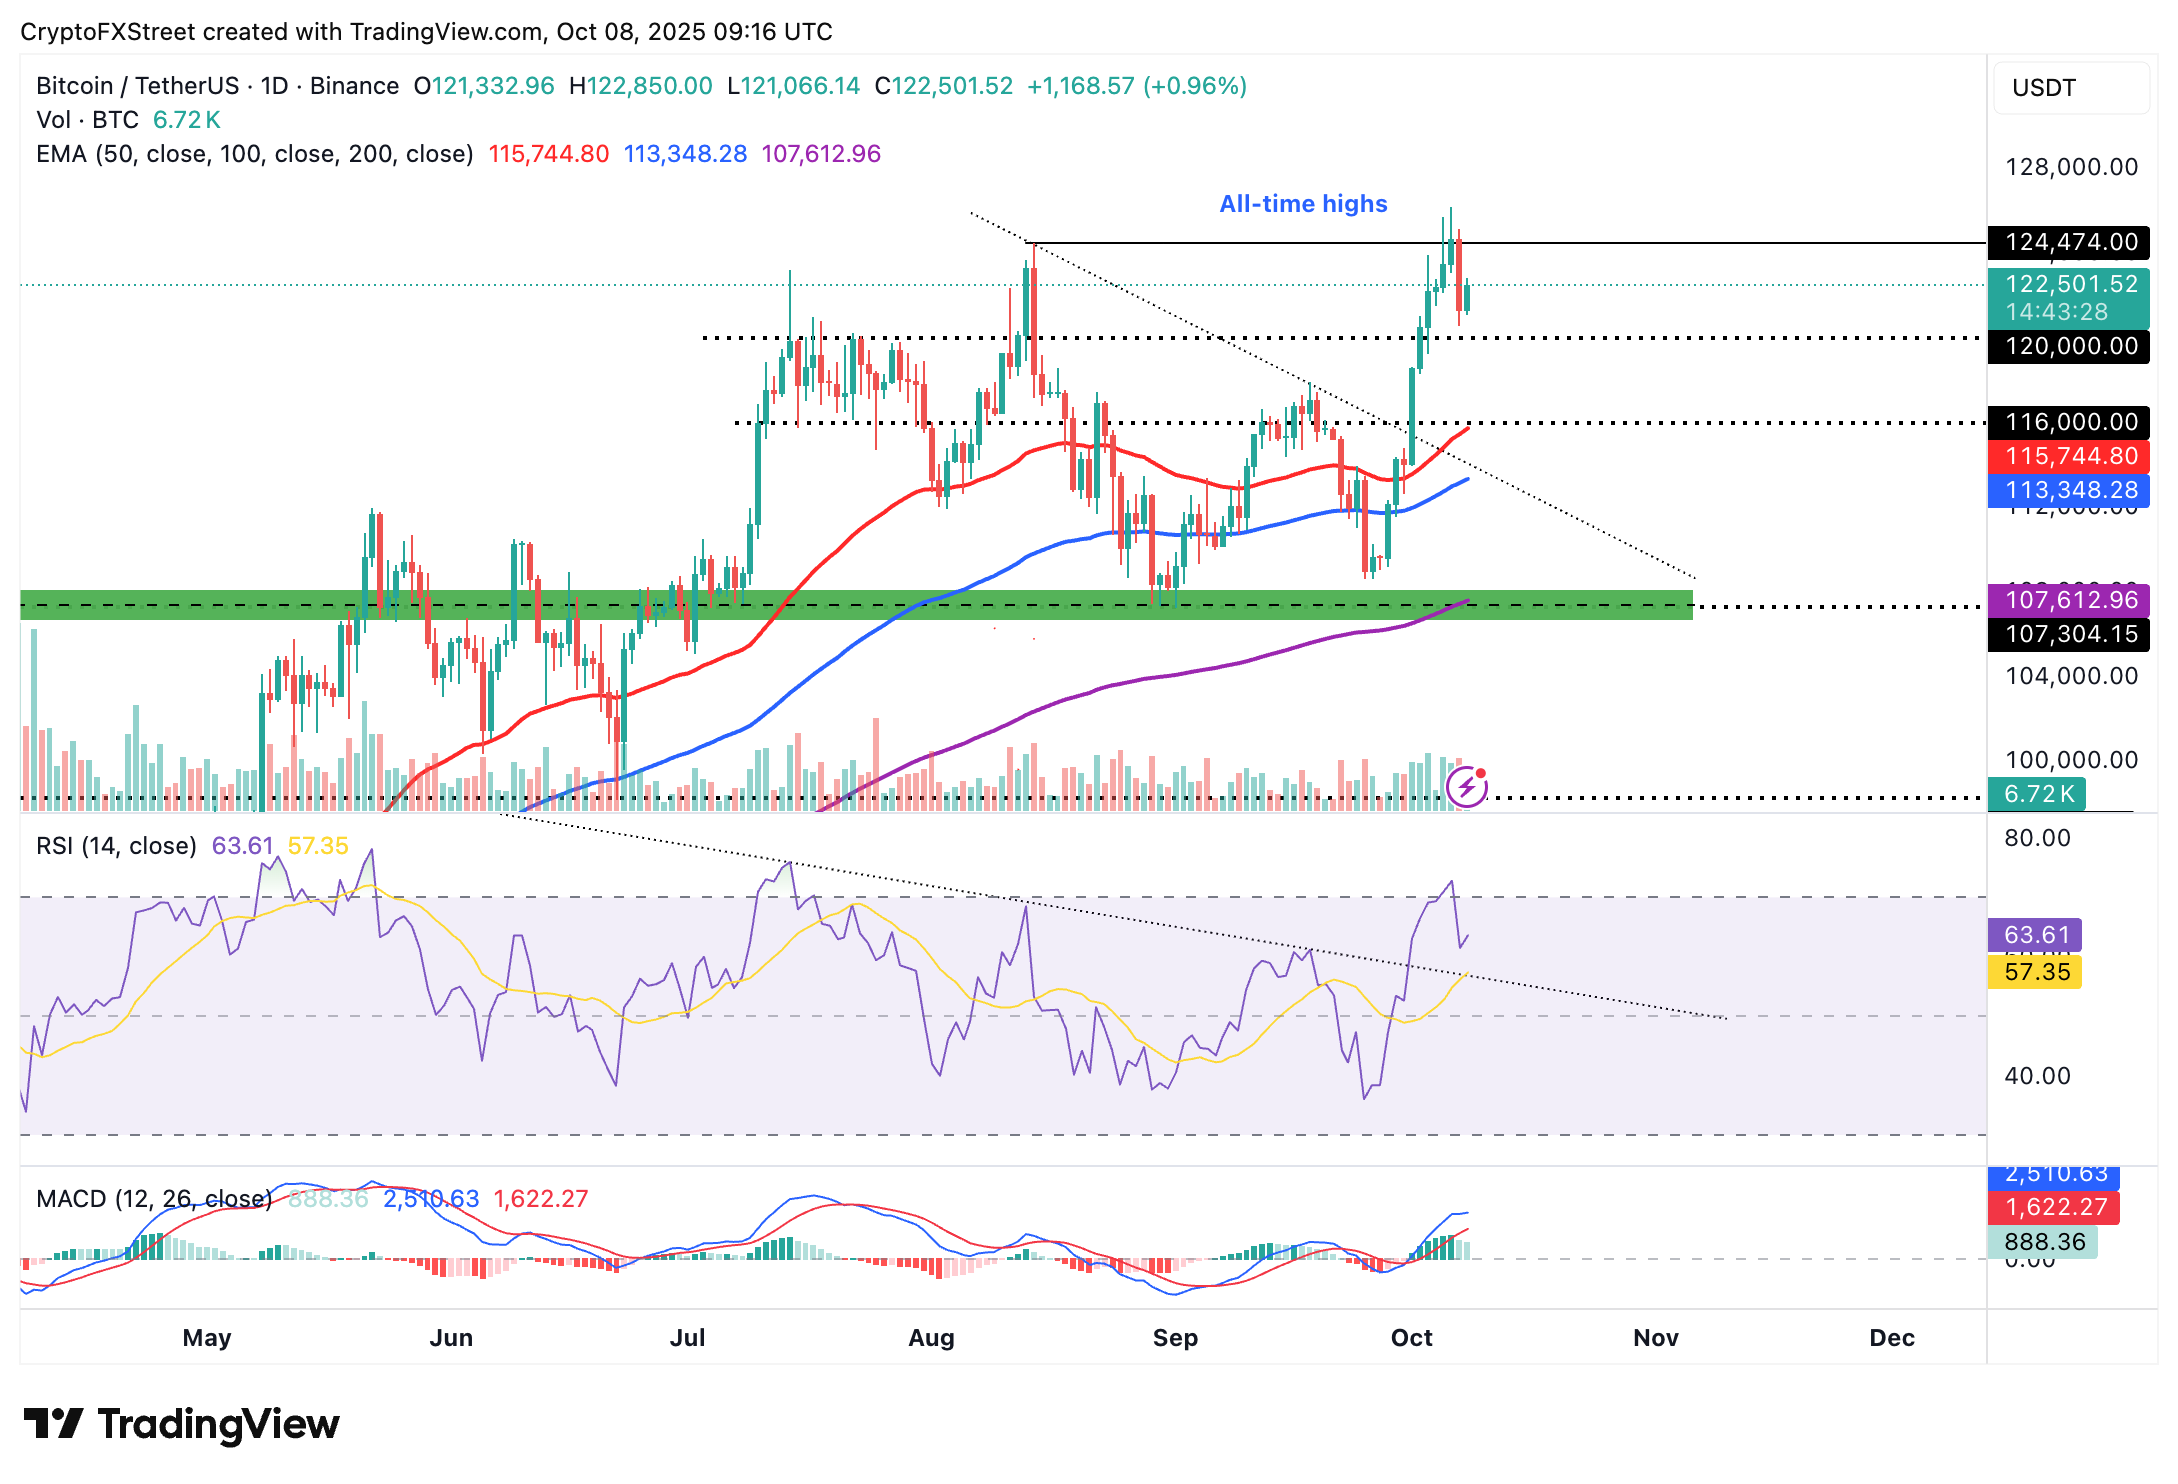
BTC/USD daily chart
Altcoins update: Ethereum, XRP pare losses, aiming for short-term gains
Ethereum holds above its short-term $4,400 support as observed on the daily chart below. The smart contracts token tumbled after failing to break resistance at the descending trendline, which has been in place since it reached its all-time high of $4,956 in late August.
Despite the pullback, Ethereum maintains a bullish structure, with the MACD indicator on the daily chart sustaining a buy signal triggered on October 7. Traders may continue increasing risk exposure if the blue MACD line remains above the red signal line.
The RSI, which is rebounding at 54 after sliding to 52 on Tuesday, backs Ethereum’s short-term bullish outlook. A bullish structure, coupled with growing institutional demand, has the potential to sustain the uptrend, eyeing the record high and a breakout above the $5,000 level.
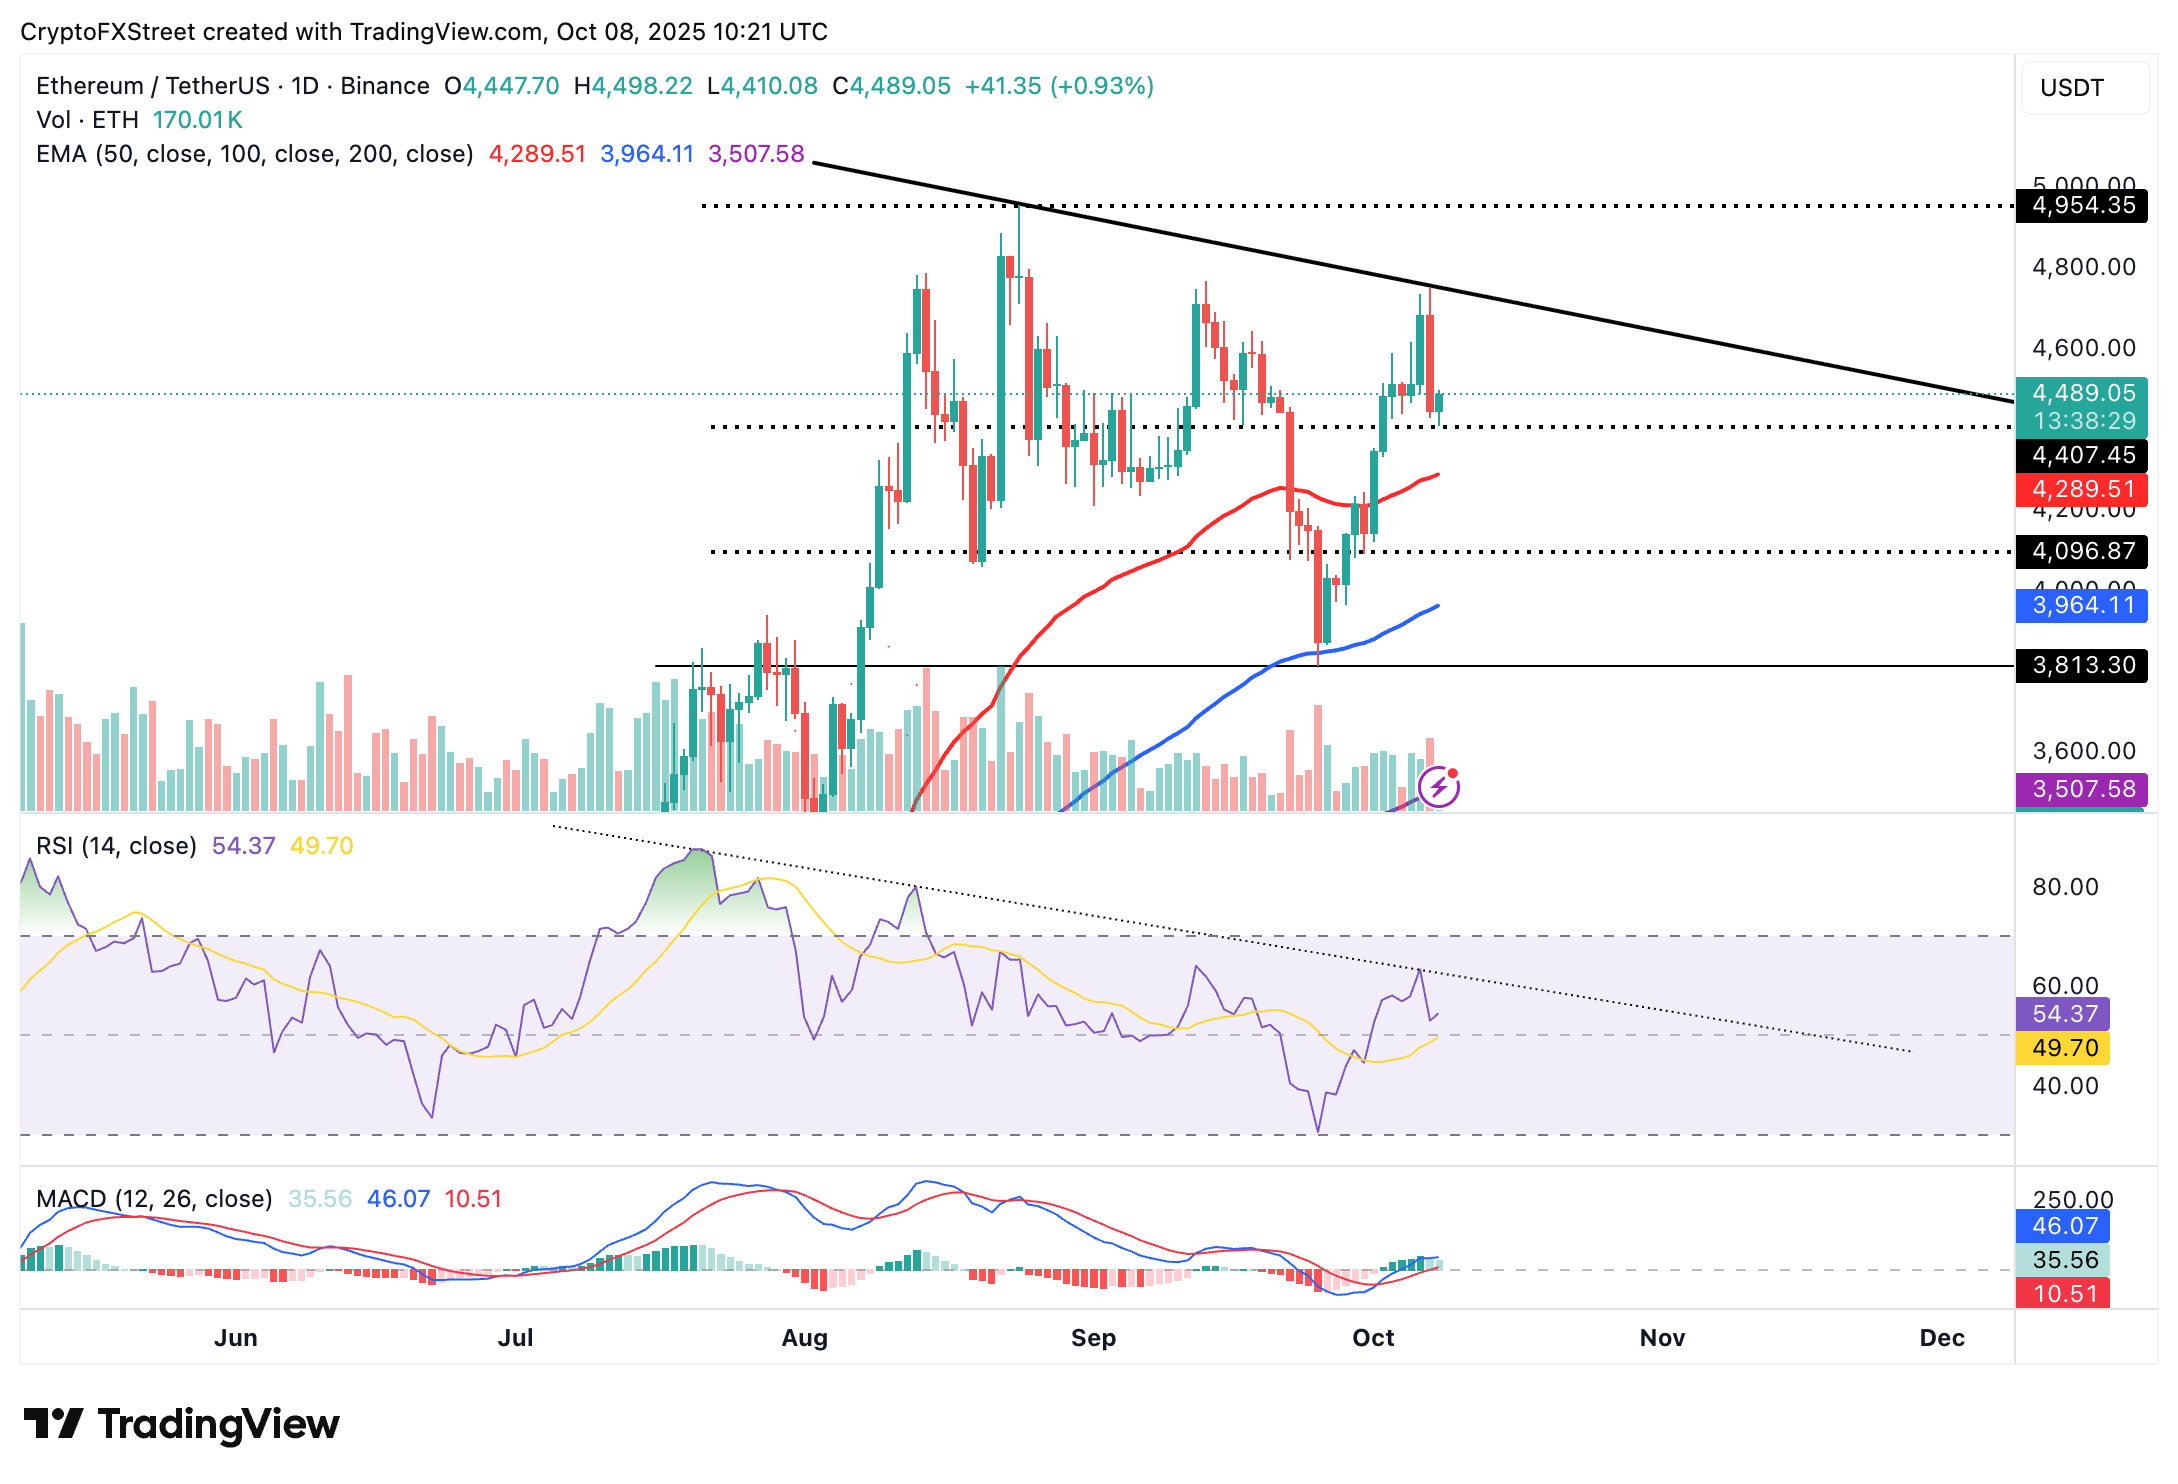
ETH/USDT daily chart
XRP, on the other hand, has reclaimed the support provided by the 100-day Exponential Moving Average (EMA) at $2.85. Key indicators highlight a strengthening bullish grip, including an upward-facing RSI at 45. However, the RSI is required to move into the bullish region above the midline to validate XRP’s potential to extend gains toward the $3.00 level.
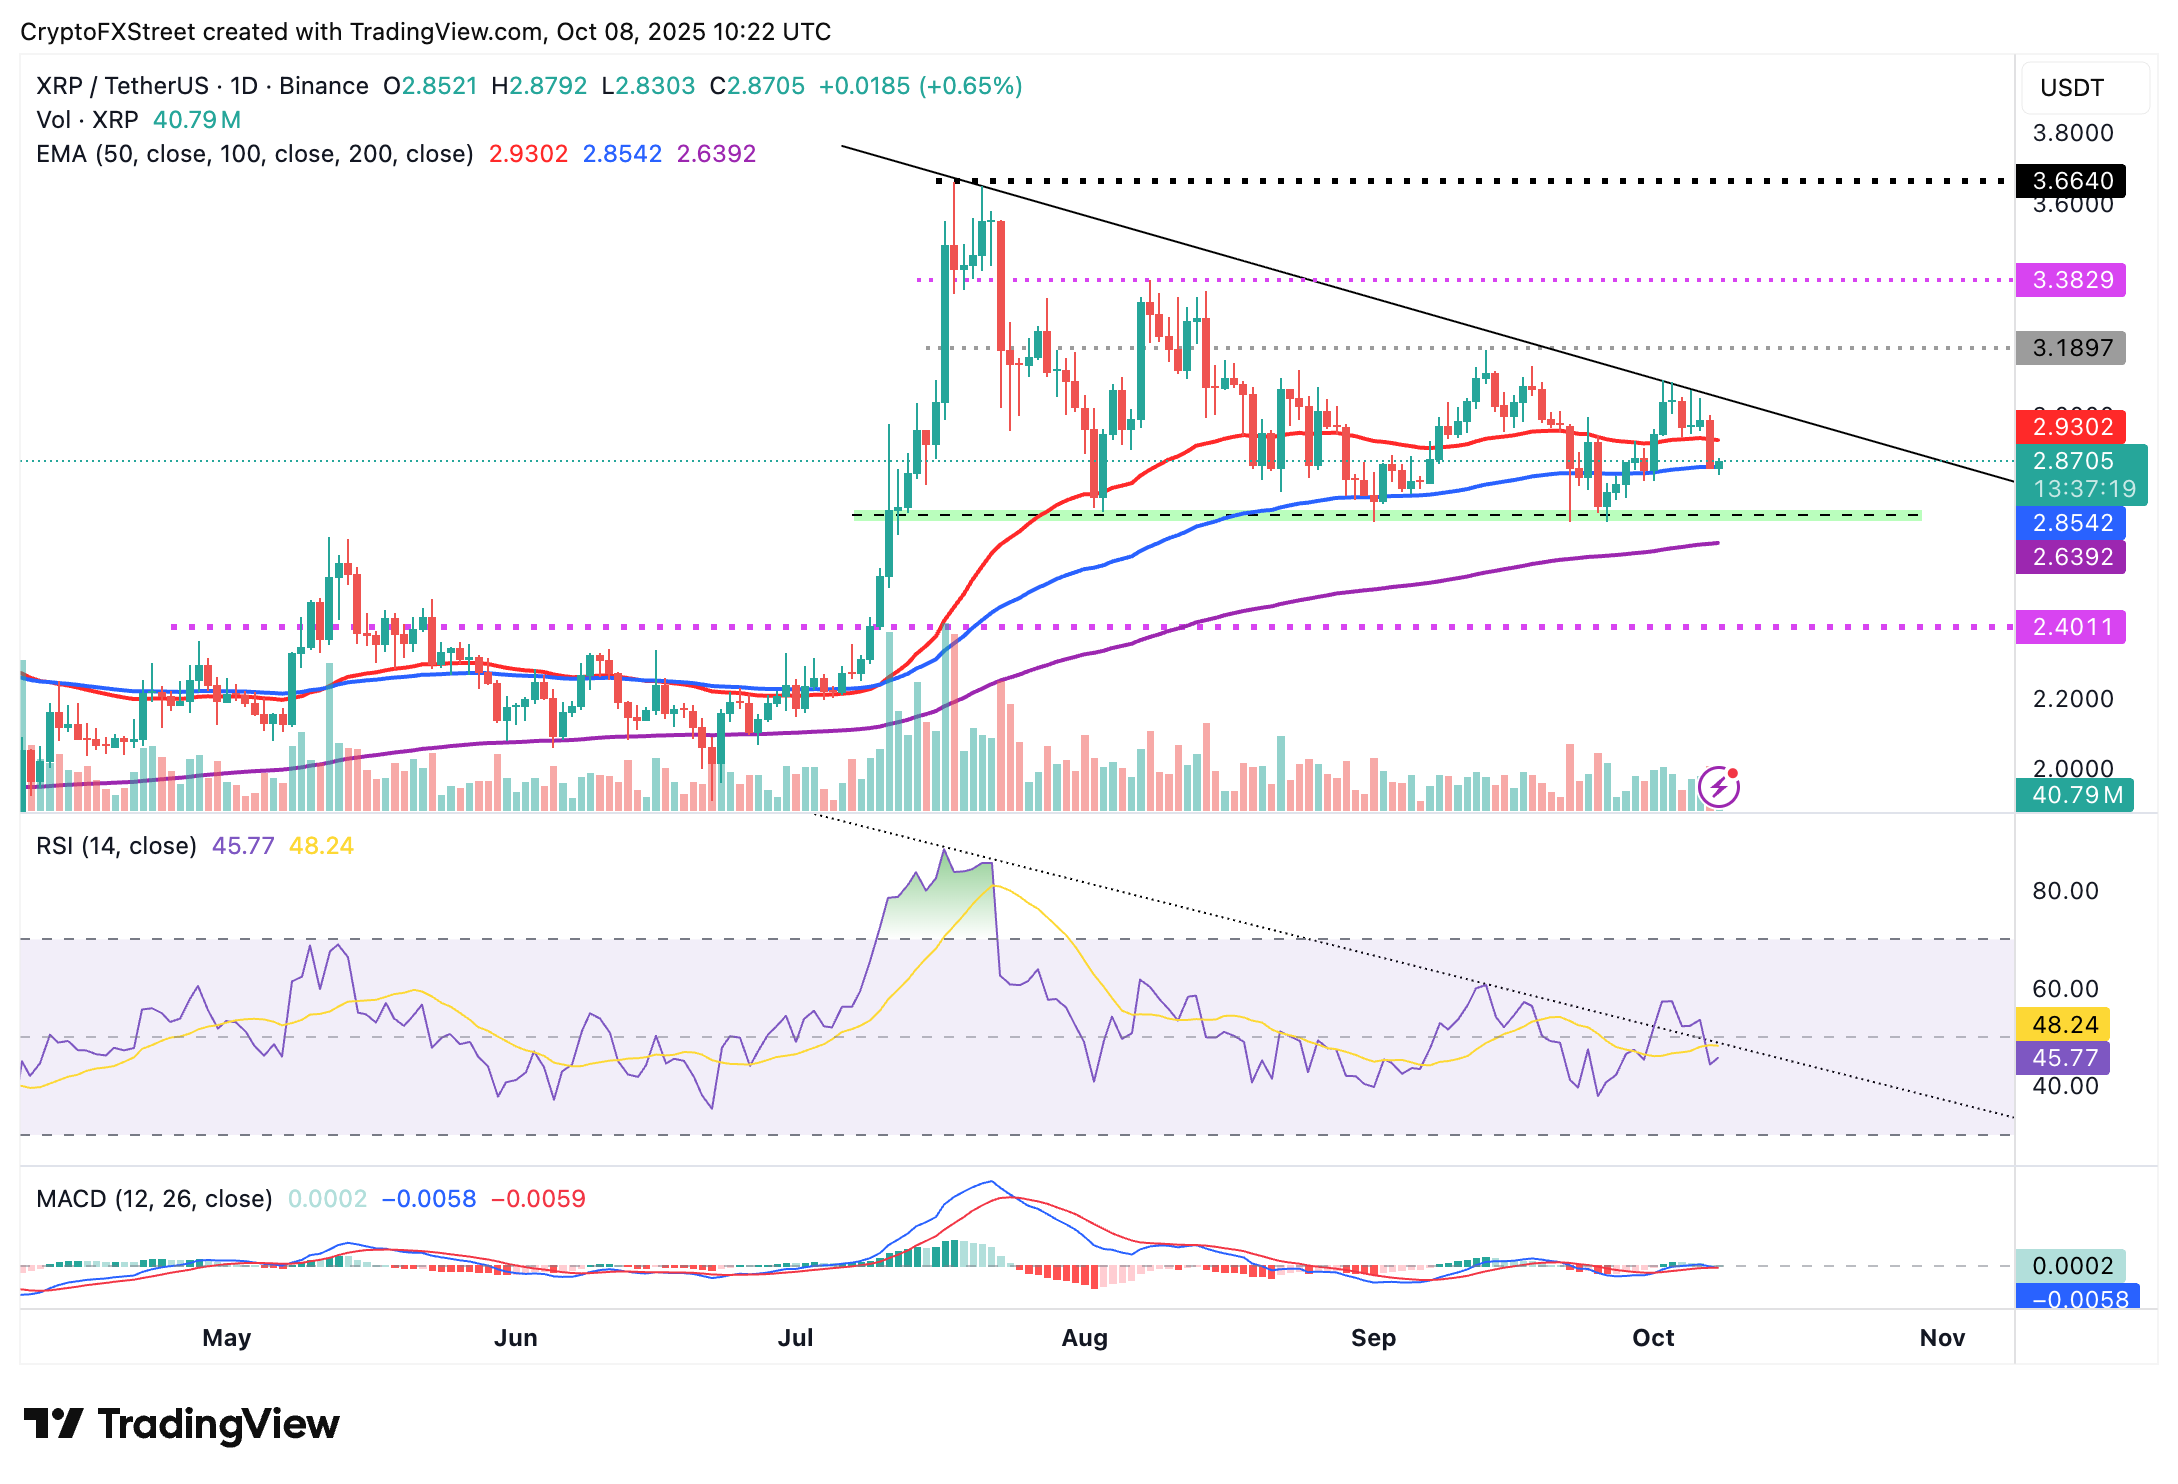
XRP/USDT daily chart
Still, the 50-day EMA at $2.93 could delay the recovery if unbroken. Below the 100-day EMA support at $2.85, the path of least resistance could flip downward, increasing the chances of XRP declining toward the 200-day EMA at $2.64.
Bitcoin, altcoins, stablecoins FAQs
Bitcoin is the largest cryptocurrency by market capitalization, a virtual currency designed to serve as money. This form of payment cannot be controlled by any one person, group, or entity, which eliminates the need for third-party participation during financial transactions.
Altcoins are any cryptocurrency apart from Bitcoin, but some also regard Ethereum as a non-altcoin because it is from these two cryptocurrencies that forking happens. If this is true, then Litecoin is the first altcoin, forked from the Bitcoin protocol and, therefore, an “improved” version of it.
Stablecoins are cryptocurrencies designed to have a stable price, with their value backed by a reserve of the asset it represents. To achieve this, the value of any one stablecoin is pegged to a commodity or financial instrument, such as the US Dollar (USD), with its supply regulated by an algorithm or demand. The main goal of stablecoins is to provide an on/off-ramp for investors willing to trade and invest in cryptocurrencies. Stablecoins also allow investors to store value since cryptocurrencies, in general, are subject to volatility.
Bitcoin dominance is the ratio of Bitcoin's market capitalization to the total market capitalization of all cryptocurrencies combined. It provides a clear picture of Bitcoin’s interest among investors. A high BTC dominance typically happens before and during a bull run, in which investors resort to investing in relatively stable and high market capitalization cryptocurrency like Bitcoin. A drop in BTC dominance usually means that investors are moving their capital and/or profits to altcoins in a quest for higher returns, which usually triggers an explosion of altcoin rallies.
Bài viết đề xuất


