
Bitcoin Weekly Forecast: Will "Uptober" deliver?
- Bitcoin rallies nearly 7% so far this week as a strong month in terms of Bitcoin performance begins.
- Institutional demand rises, with $2.25 billion in spot ETF inflows, as well as continued BTC purchases from big corporates.
- Risk-on sentiment strengthens as traders fully price in a Fed rate cut in October despite the uncertainty from the US government shutdown.
Bitcoin (BTC) price hovers around $120,000 at the time of writing on Friday, following a strong weekly rally of nearly 7% amid optimism surrounding the ‘Uptober’ narrative. Institutional demand supports the price rise, with BTC’s spot Exchange Traded Funds (ETFs) recording a weekly inflow of over $2 billion, while firms such as Metaplanet and Strategy add BTC to their reserves.
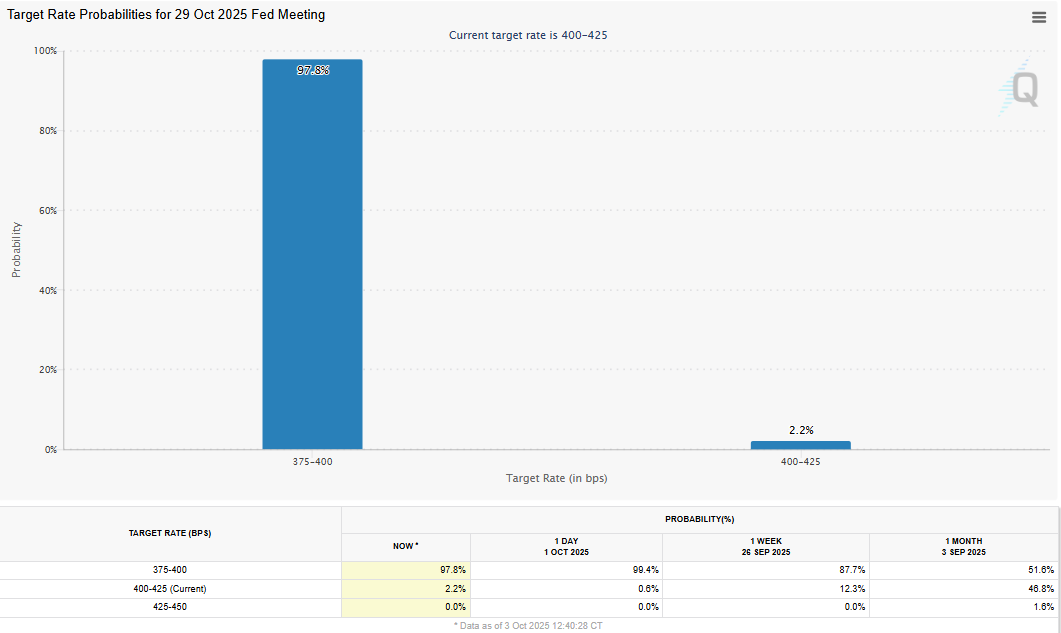
Adding to this bullish outlook, risk-on sentiment strengthens as market participants price in an over 97% chance that the US Federal Reserve (Fed) will lower borrowing costs on October 29.
Positive returns in Q3, strong Q4 ahead?
Bitcoin price closed September on a positive note, with a 5.16% gain, finishing above $114,000. Looking at the quarterly results, BTC’s third quarter as a whole delivered a modest 6.31% gain, as shown in the Coinglass chart below.
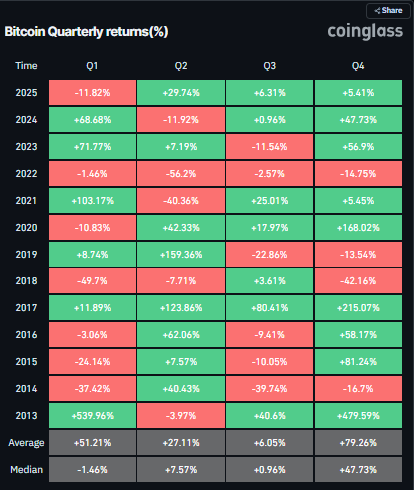
BTC Quarterly returns chart. Source: Coinglass
Historical data for Bitcoin shows that October has generally delivered a high return for the cryptocurrency, averaging 20.62%, hence the market terming it as a ‘Uptober’ rally. For the past 11 years (from 2013 to 2024), BTC has had a positive return nine times.
Adding to this optimism, the fourth quarter (Q4) has also been the best quarter for BTC , with an average of 78.88% gains. If such a pattern repeats in 2025, BTC could reach new highs by the end of the year.
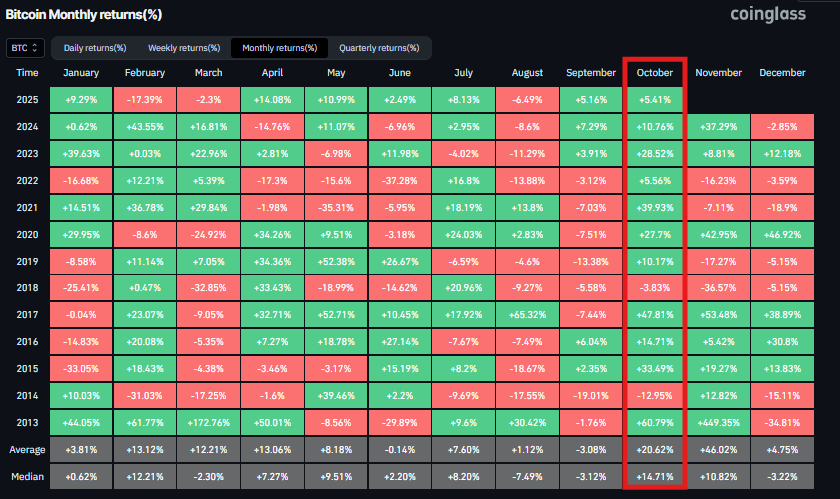
Bitcoin Monthly returns chart. Source: Coinglass
Macroeconomic conditions support Bitcoin
Bitcoin price rally was supported by favorable macroeconomic conditions this week even as the US government began a shutdown after Congress failed to pass a funding bill. The news pressured the US Dollar (USD), which slipped under modest selling pressure, and with BTC’s inverse correlation to the USD, the cryptocurrency surged.
Adding to this, the Automatic Data Processing (ADP) reported on Wednesday that private-sector employers shed 32,000 jobs in September, marking the biggest drop since March 2023. Moreover, the August payrolls number was revised to show a loss of 3,000, compared to an increase of 54,000 initially reported. The data reinforced bets for two more interest-rate cuts by the Federal Reserve by the year-end.
According to the CME Group’s FedWatch tool, traders are pricing in an over 97% chance that the US Federal Reserve will lower borrowing costs by 25 basis points on October 29.
Return of institutional investors
Bitcoin price surge was also supported by strong institutional demand this week. According to SoSoValue data (chart below), Bitcoin spot ETFs recorded a total of $2.25 billion in inflows as of Thursday, the highest weekly inflow since mid-September and more than offsetting the $902.5 million outflows seen in the previous week.
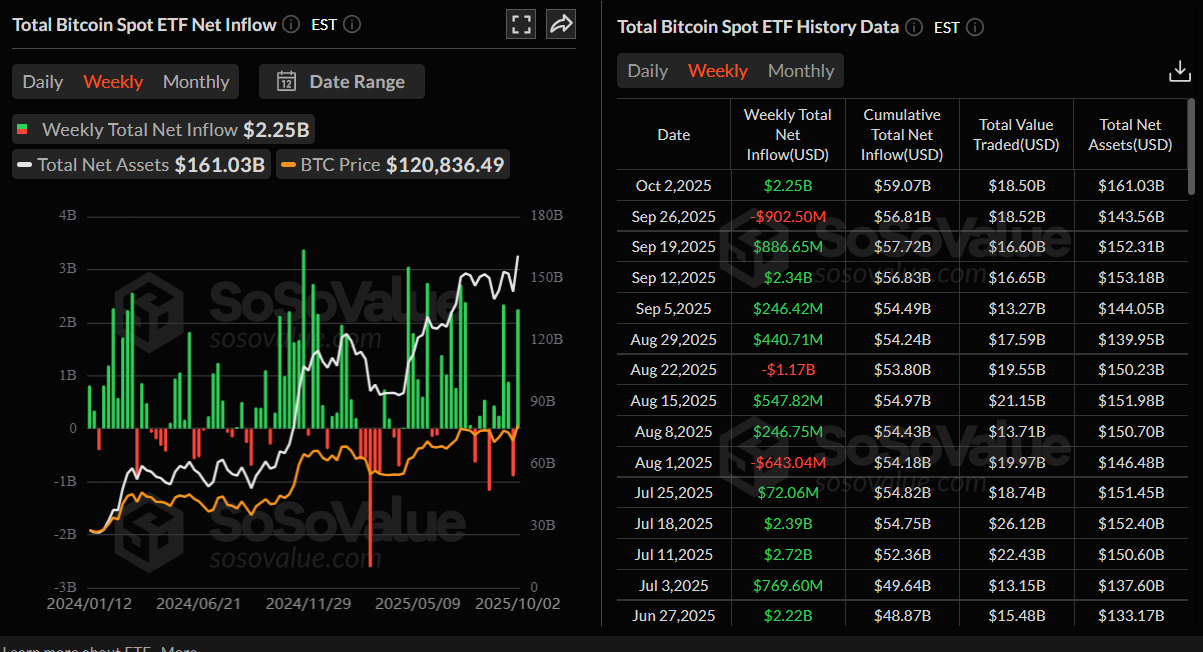
Bitcoin Spot ETF net inflow weekly chart. Source: SoSoValue
On the corporate front, Japanese investment firm Metaplanet purchased an additional 5,268 BTC, bringing the firm’s total holdings to 30,823 BTC on Wednesday.
Strategy also announced that it had added 196 BTC to its reserve, bringing the total to 640,031 BTC.

Several altcoin ETFs to launch in October
The approval of many spot altcoin ETFs, expected in the next few weeks, could further fuel the "Uptober" narrative.
The US Securities and Exchange Commission (SEC) has recently approved generic listing standards to streamline ETF approvals, setting the stage for prompt approvals.
In this regard, K33 Research said this week that ETFs are a potential catalyst for altering crypto sentiment.
The analyst writing the report said that many altcoins are expected to see ETF launches throughout October, which may reinvigorate bullish demand. Following the launch of BTC ETFs, Vanguard is reportedly exploring offering crypto ETFs to its brokerage clients, a meaningful development after nearly two years of repeated skepticism.
However, the analyst concluded that the market still faces elevated uncertainties due to the partial shutdown of the US government, which might impact liquidity, delay economic data releases and even altcoin ETF approvals. Alongside the shutdown, major Asian markets are entering banking holidays, which may further soften liquidity in the near term.
Exchange reserve hits its lowest since 2018
CryptoQuant's Bitcoin Exchange Reserve - All Exchanges chart below shows that the reserve has dropped to 2.4 million this week, extending its decline since early September.
The BTC reserve at the exchange has reached its lowest level since 2018, indicating lower selling pressure from investors and a reduced supply available for trading.
A drop in reserve also signals an increasing scarcity of coins, an occurrence typically associated with bullish market movements.
-1759479695258-1759479695259.png)
Bitcoin Exchange Reserve - All Exchanges chart. Source: CryptoQuant
Some signs of concern
BTC futures CME (Chicago Mercantile Exchange) 4-hour chart shows a gap between $110,990 and $111,355 caused by the weekend Bitcoin move. Historically, the market tends to fill these gaps before resuming its ongoing trend.
Traders should closely monitor these levels, as BTC could first retrace toward this gap before resuming its rally.
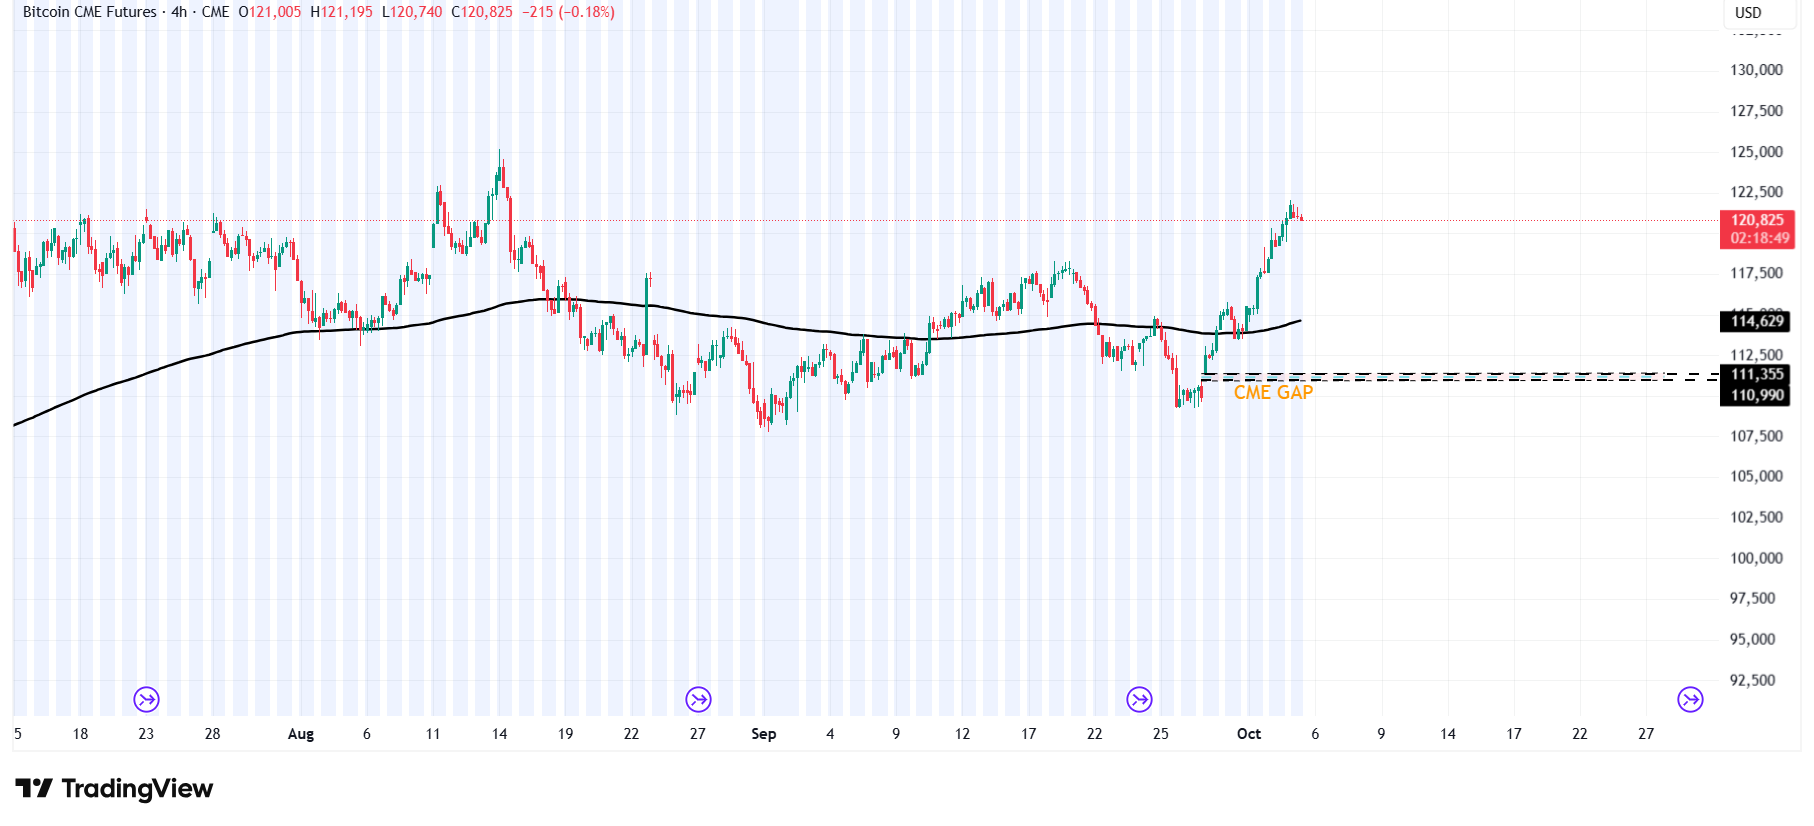
BTC CME 4-hour chart
Will BTC reach a new all-time high?
BTC recovered nearly 7% so far this week. At the time of writing on Friday, trading around the psychological level at $120,000 (which is the highest weekly close).
If BTC closes above $120,000 on a weekly basis, it could extend the rally toward the all-time high of $124,474. If a successful close above this level occurs, BTC would enter price discovery mode, with a target at $145,159, which aligns with the 141.40% Fibonacci extension level drawn from the April low of $74,508 to the ATH at $124,474.
The Relative Strength Index (RSI) on the weekly chart reads 60, which is above its neutral level of 50, indicating that bullish momentum is gaining traction.
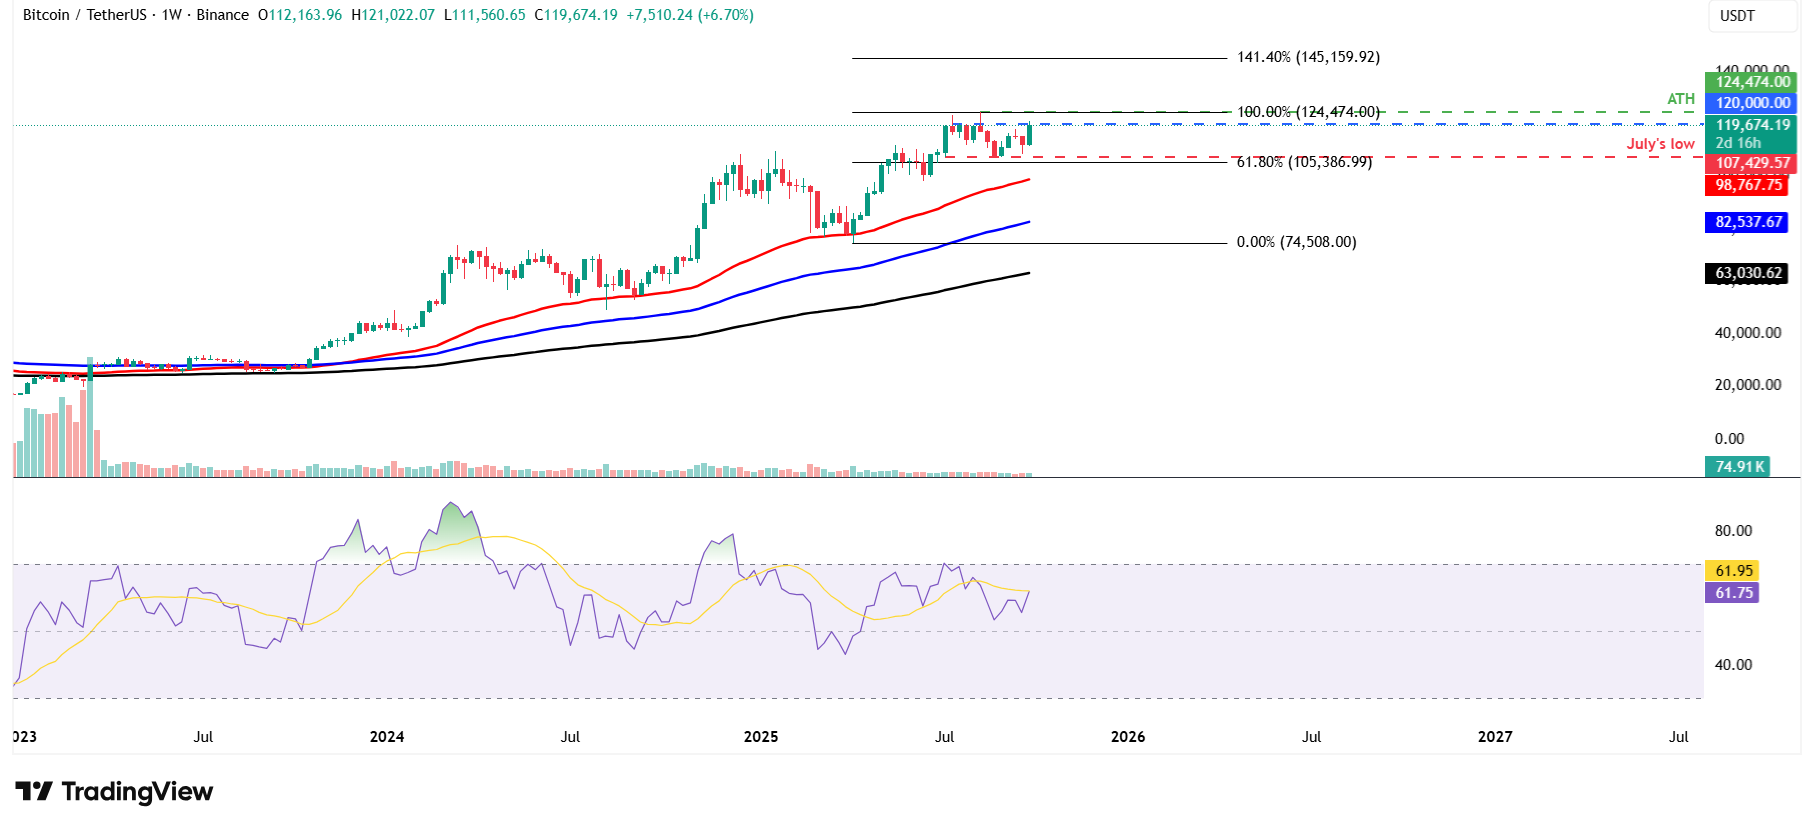
BTC/USDT weekly chart
On the daily chart, Bitcoin started the week on a positive note, adding 1.92% on Monday and closing above the 50-day Exponential Moving Average (EMA) at $114,076. However, on Tuesday, BTC declined slightly but found support around the 50-day EMA, continuing its rally for the next two days and closing above $120,000.
The RSI on the daily chart reads 63, above the neutral level of 50, indicating bullish momentum. Additionally, the Moving Average Convergence Divergence (MACD) showed a bullish crossover on Wednesday, providing a buy signal and suggesting the start of an upward trend ahead.
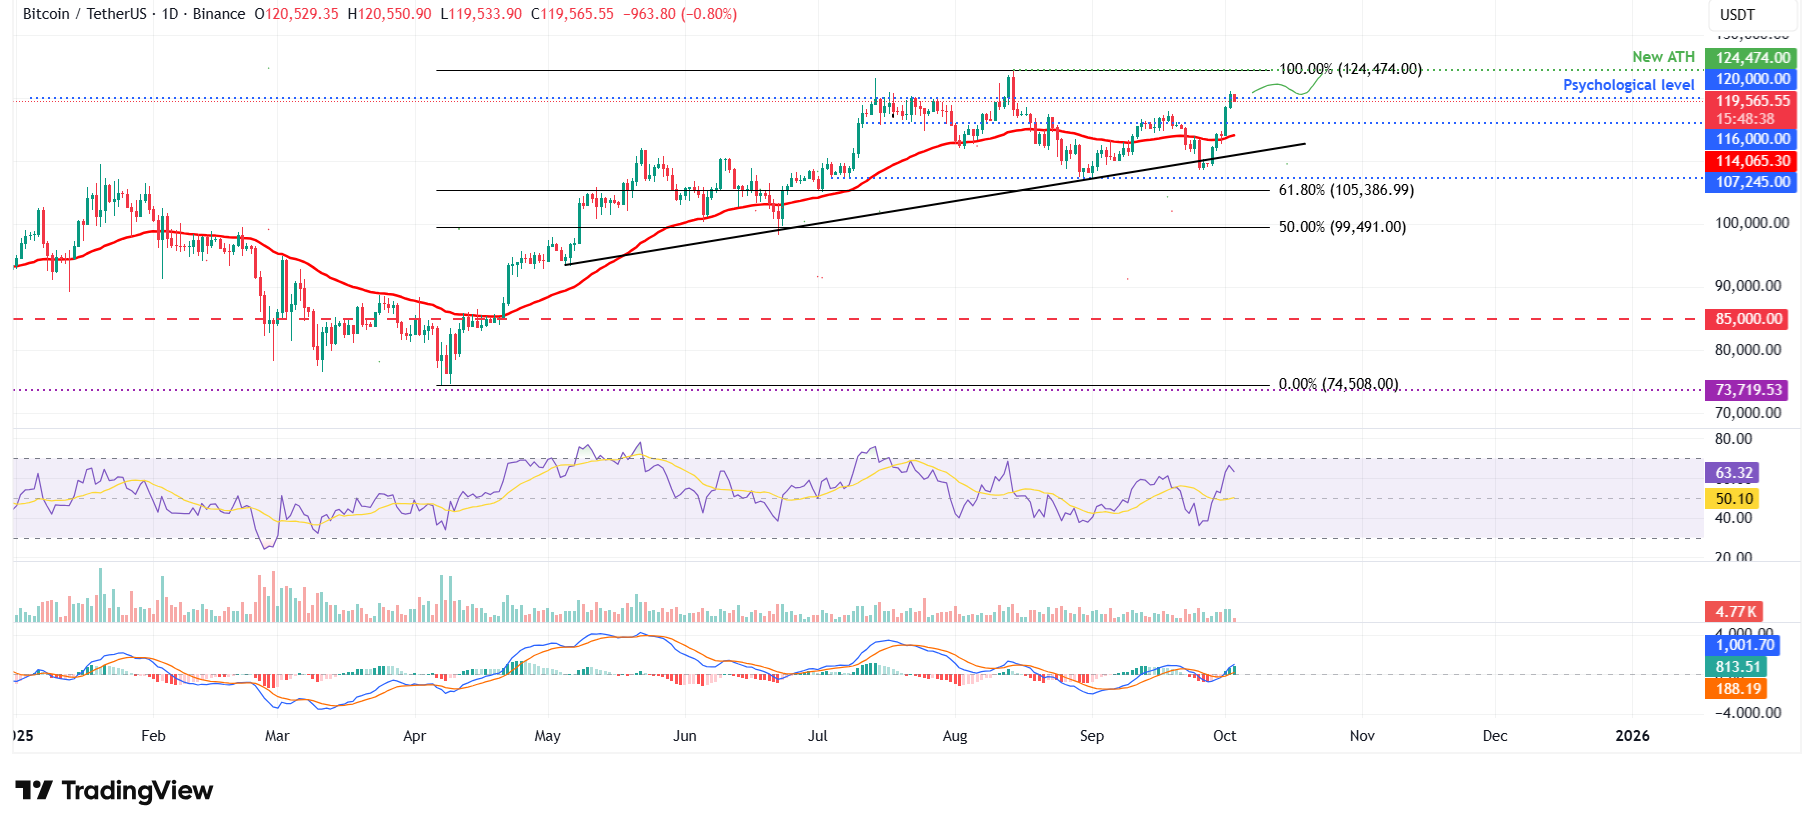
BTC/USDT daily chart
If BTC faces a correction, it could extend the decline toward the daily support at $116,000.
Bitcoin, altcoins, stablecoins FAQs
Bitcoin is the largest cryptocurrency by market capitalization, a virtual currency designed to serve as money. This form of payment cannot be controlled by any one person, group, or entity, which eliminates the need for third-party participation during financial transactions.
Altcoins are any cryptocurrency apart from Bitcoin, but some also regard Ethereum as a non-altcoin because it is from these two cryptocurrencies that forking happens. If this is true, then Litecoin is the first altcoin, forked from the Bitcoin protocol and, therefore, an “improved” version of it.
Stablecoins are cryptocurrencies designed to have a stable price, with their value backed by a reserve of the asset it represents. To achieve this, the value of any one stablecoin is pegged to a commodity or financial instrument, such as the US Dollar (USD), with its supply regulated by an algorithm or demand. The main goal of stablecoins is to provide an on/off-ramp for investors willing to trade and invest in cryptocurrencies. Stablecoins also allow investors to store value since cryptocurrencies, in general, are subject to volatility.
Bitcoin dominance is the ratio of Bitcoin's market capitalization to the total market capitalization of all cryptocurrencies combined. It provides a clear picture of Bitcoin’s interest among investors. A high BTC dominance typically happens before and during a bull run, in which investors resort to investing in relatively stable and high market capitalization cryptocurrency like Bitcoin. A drop in BTC dominance usually means that investors are moving their capital and/or profits to altcoins in a quest for higher returns, which usually triggers an explosion of altcoin rallies.
Bài viết đề xuất


