
Bitcoin Price Forecast: BTC risks decline to fill CME gap before potential recovery
- Bitcoin price trades around $112,200 on Monday, having lost 2.66% in the previous week.
- US-listed spot Bitcoin ETFs recorded over $900 million in outflows, marking a break from a four-week streak of inflows.
- Technically, CME futures show a gap between $110,990 and $111,355, which BTC may revisit before attempting a recovery.
Bitcoin (BTC) trades at around $112,200 at the time of writing on Monday after a 2.66% correction last week. The weakening institutional demand also adds to the bearish pressure as spot Exchange Traded Funds (ETFs) recorded over $900 million in outflows. Traders should remain vigilant as technical signals indicate a potential dip toward the CME futures gap, which ranges from $101,700 to $103,300, before any meaningful recovery attempt.
Bitcoin institutional demand weakens
The SoSoValue data shows that Bitcoin spot ETFs recorded a total of $902.50 million in outflows last week, breaking the four-week streak of positive flows since the end of August. If this outflow continues and intensifies, BTC could experience further correction ahead.
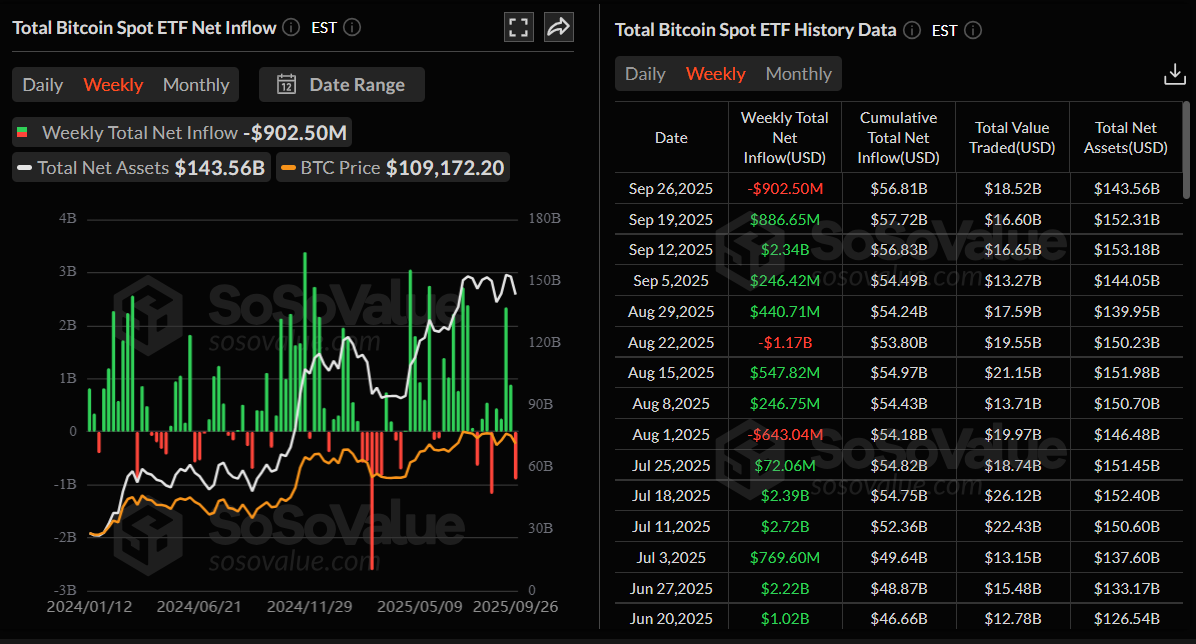
Bitcoin spot ETF netflow weekly chart. Source: SoSoValue
Bitcoin exchange reserve drops to 2.3 million BTC
The Bitcoin Exchange Reserve – All Exchanges chart below from CryptoQuant shows the reserve has dropped to 2.3 million as of Monday and has been consistently declining since mid-July 2024.
The BTC reserve at the exchange has reached its lowest level since July 2018, indicating lower selling pressure from investors and a reduced supply available for trading. A drop in reserve also signals an increasing scarcity of coins, an occurrence typically associated with bullish market movements.
-1759136687432-1759136687434.png)
Bitcoin Exchange Reserve– All Exchanges chart. Source: CryptoQuant
Bitcoin Price Forecast: BTC price could decline to fill the CME gap before recovering
BTC futures CME (Chicago Mercantile Exchange) 4-hour chart shows a gap between $110,990 and $111,355 caused by weekend Bitcoin moves . Historically, the market tends to fill these gaps before resuming its ongoing trend. In such a case, BTC could decline first toward its CME gap, which roughly coincides with the levels mentioned above, before resuming its recovery.
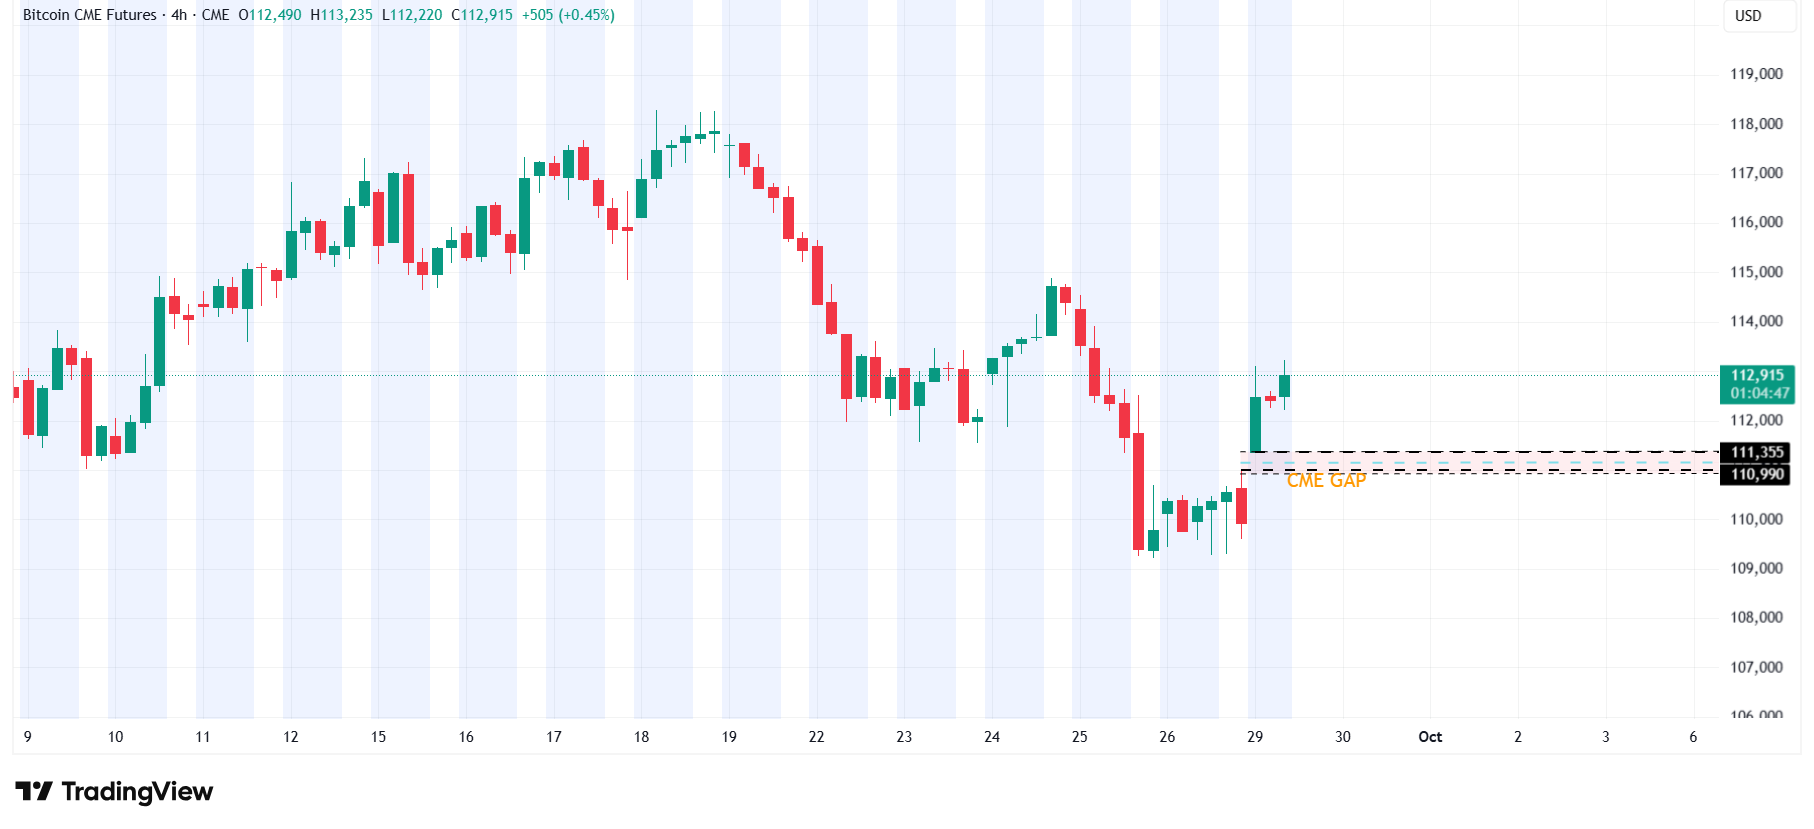
BTC CME 4-hour chart
On the daily chart, Bitcoin price failed to find support around $116,000 on September 19 and declined by 6%, reaching a low of $108,631 on Thursday. However, BTC recovered slightly in the next three days. At the time of writing on Monday, it trades at around $112,200.
If BTC continues its recovery and closes above the 50-day Exponential Moving Average (EMA) at 113,253 on a daily basis, it could extend the recovery toward the daily resistance at $116,000.
The Relative Strength Index (RSI) on the daily chart reads 47, pointing upwards and nearing its neutral level of 50, which indicates a fading bearish momentum. For the recovery rally to be sustained, the RSI must move above the neutral level.
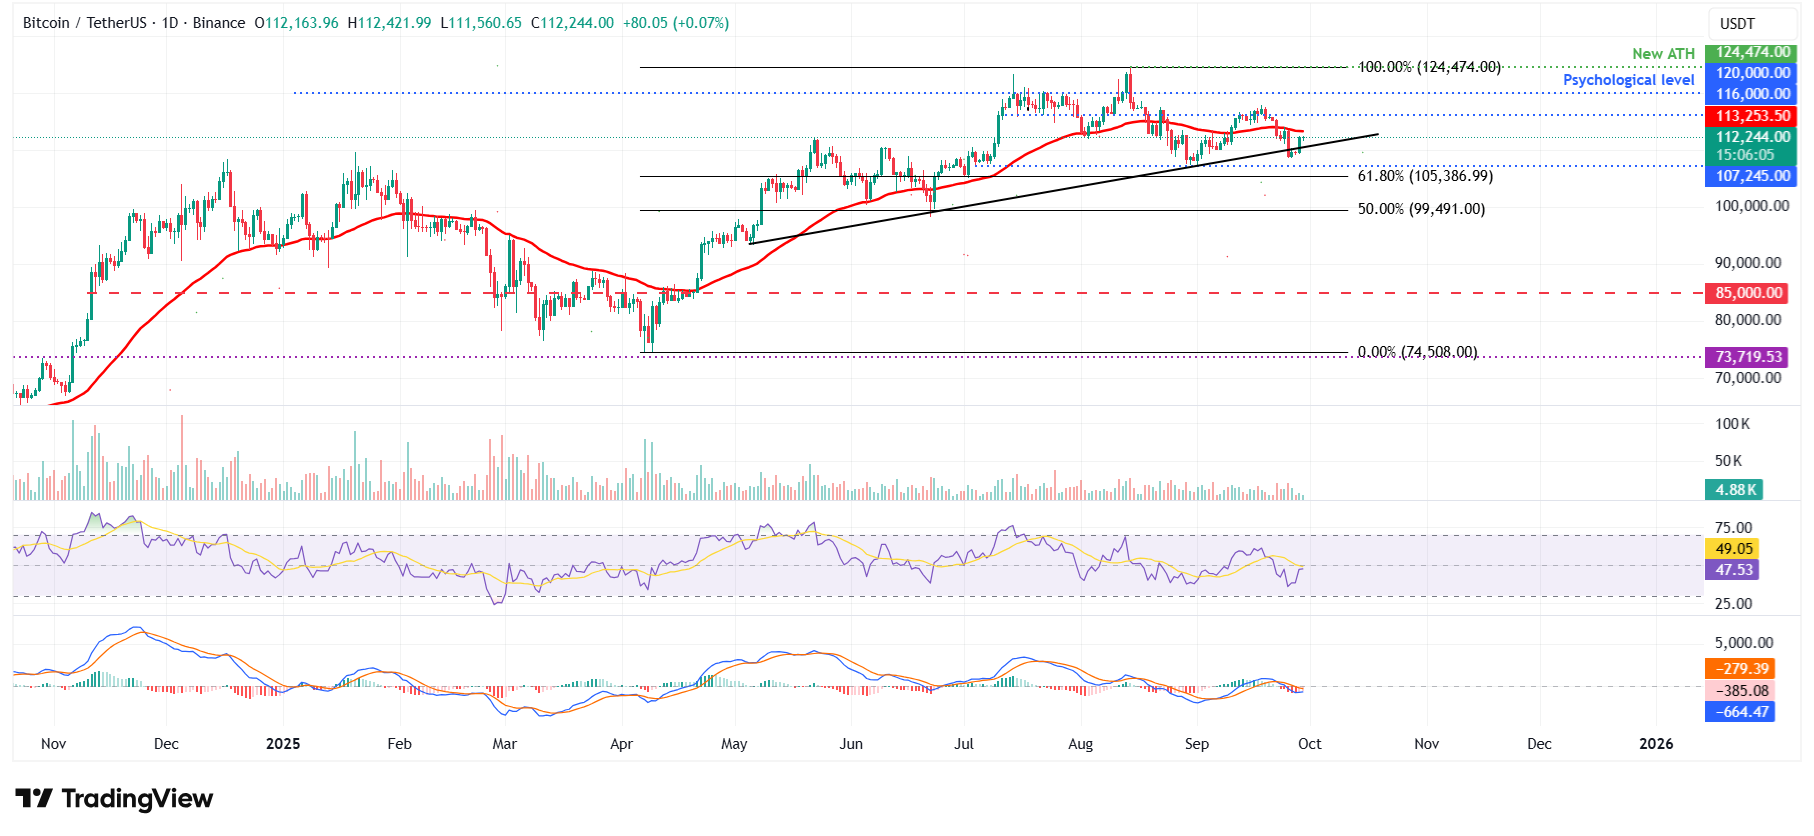
BTC/USDT daily chart
However, if BTC fails to close above the 50-day EMA and faces a correction, it could extend the decline toward Sunday’s low at $109,189, which would fill the CME gap as mentioned above.
Bitcoin, altcoins, stablecoins FAQs
Bitcoin is the largest cryptocurrency by market capitalization, a virtual currency designed to serve as money. This form of payment cannot be controlled by any one person, group, or entity, which eliminates the need for third-party participation during financial transactions.
Altcoins are any cryptocurrency apart from Bitcoin, but some also regard Ethereum as a non-altcoin because it is from these two cryptocurrencies that forking happens. If this is true, then Litecoin is the first altcoin, forked from the Bitcoin protocol and, therefore, an “improved” version of it.
Stablecoins are cryptocurrencies designed to have a stable price, with their value backed by a reserve of the asset it represents. To achieve this, the value of any one stablecoin is pegged to a commodity or financial instrument, such as the US Dollar (USD), with its supply regulated by an algorithm or demand. The main goal of stablecoins is to provide an on/off-ramp for investors willing to trade and invest in cryptocurrencies. Stablecoins also allow investors to store value since cryptocurrencies, in general, are subject to volatility.
Bitcoin dominance is the ratio of Bitcoin's market capitalization to the total market capitalization of all cryptocurrencies combined. It provides a clear picture of Bitcoin’s interest among investors. A high BTC dominance typically happens before and during a bull run, in which investors resort to investing in relatively stable and high market capitalization cryptocurrency like Bitcoin. A drop in BTC dominance usually means that investors are moving their capital and/or profits to altcoins in a quest for higher returns, which usually triggers an explosion of altcoin rallies.
Bài viết đề xuất


