Meme Coin Price Prediction: DOGE, SHIB, PEPE test key levels amid muted interest
- Dogecoin holds at a symmetrical triangle’s support trendline amid increasing bearish pressure.
- Shiba Inu trend remains volatile but sustains above the $0.00001166 support level.
- Pepe tests support at the $0.00001000 psychological level amid a Death Cross between two crucial moving averages.
Meme coins such as Dogecoin (DOGE), Shiba Inu (SHIB), and Pepe (PEPE) are holding at crucial support areas as a potential altcoin season loads. However, interest remains muted in the derivatives market as meme coins suffer from declining open interest.
Interest remains low as altcoin season loads
CoinGlass data shows that the Open Interest (OI) of Dogecoin, Shiba Inu, and PEPE has decreased by nearly 2%, 7%, and 4%, respectively. Typically, a loss in OI refers to a decline in interest from derivatives traders, resulting in capital outflows as they wait and see on the sidelines.

Open interests. Source: Coinglass
Adding credence to declining interest, the volumes in DOGE and PEPE are down by nearly 20% while SHIB suffers an almost 40% drop.
Furthermore, the long-to-short ratio of meme coins remains nearly neutral, with a bullish tilt in Shiba Inu and Pepe, while a bearish influence persists in Dogecoin.
The lowered interest rate could delay the rebound in meme coins, while the market shows increased signs of a potential altseason loading. CoinMarketCap’s Altcoin Season Index shows the altseason score rising to 59, the highest in the last three months. The Altcoin Season starts when this index rises above the 75 level.

Altcoin Season Index. Source: CoinMarketCap
Dogecoin could mark a triangle pattern fallout
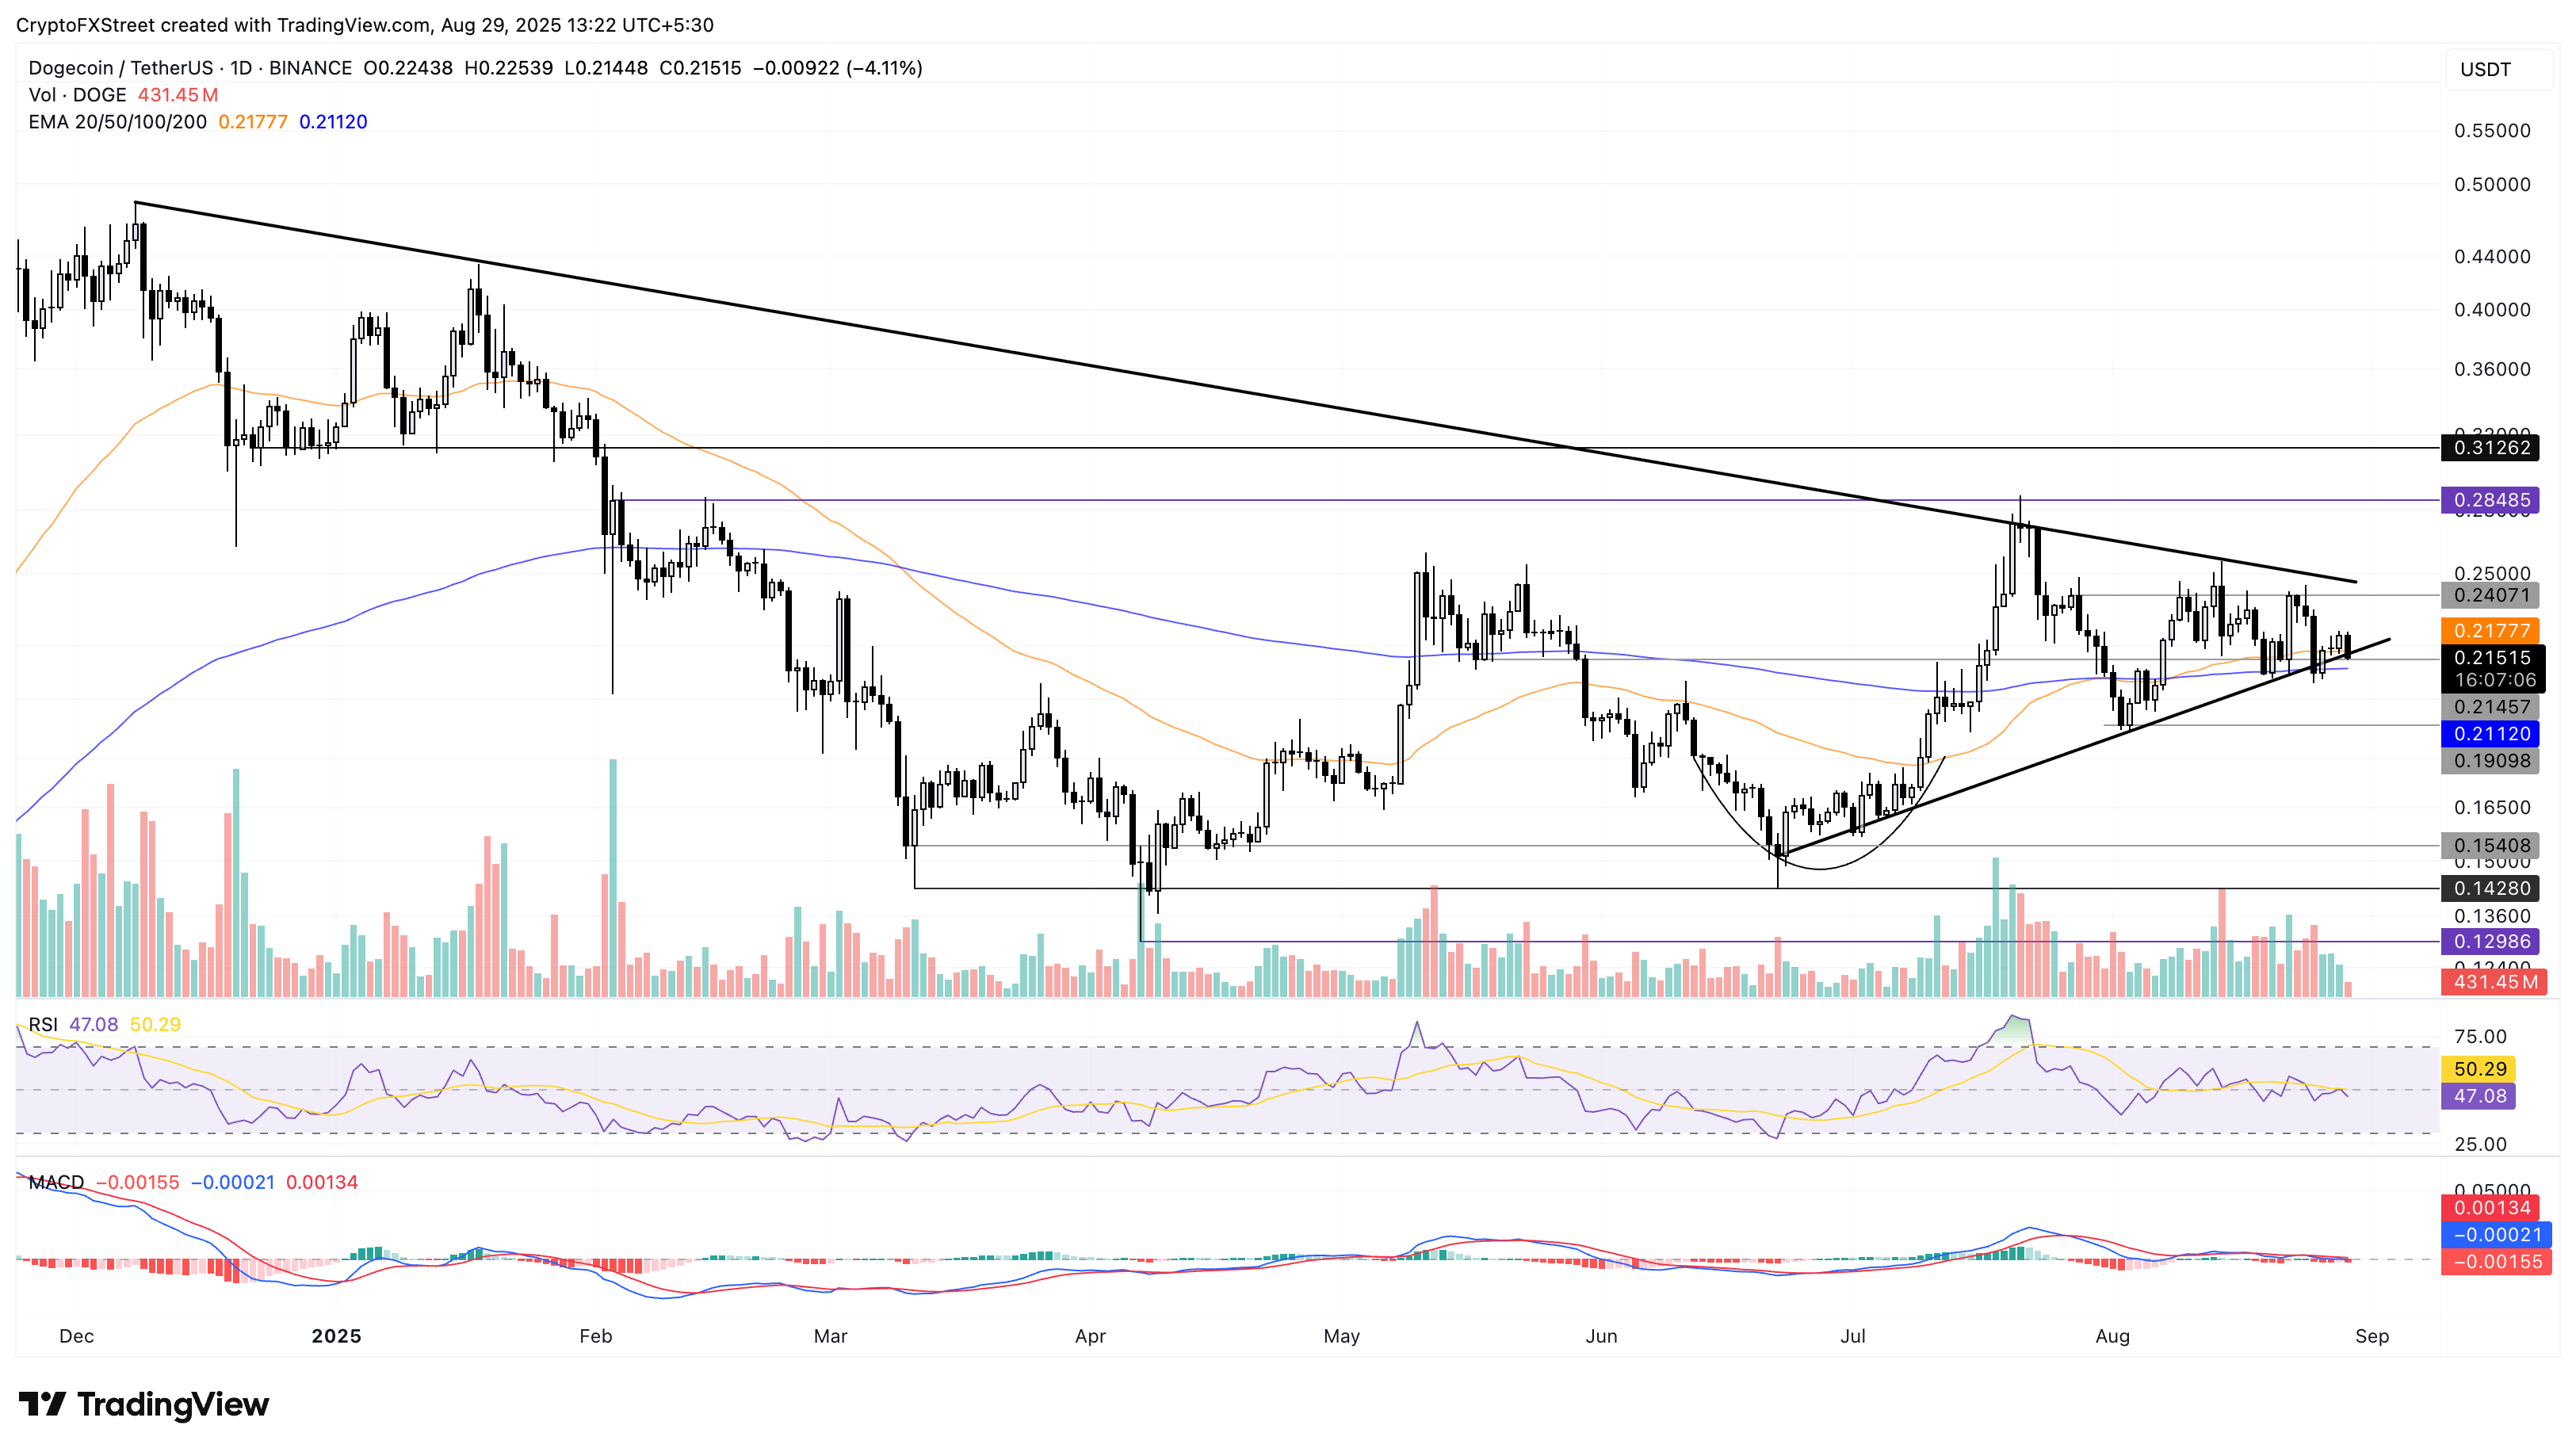
Dogecoin trades at $0.2151, losing 4% at press time on Friday and erasing the 2.49% gains from the previous day. The oldest dog-themed meme coin risks losing the 50-day Exponential Moving Average at $0.2177.
A potential close below this dynamic average line would breach a rising support trendline, marking the fallout from a symmetrical triangle pattern. In such a case, DOGE could breach the 200-day EMA to retest the $0.1909 level, last tested on August 3.
The momentum indicators on the daily chart indicate a bearish shift, underpinned by a declining Relative Strength Index (RSI) at 46, which is below the halfway line, and the Moving Average Convergence Divergence (MACD) is approaching the zero line after crossing below its signal line.

DOGE/USDT daily price chart.
Looking up, a potential reversal in DOGE could test the upper trendline of the symmetrical triangle pattern near the $0.2500 round figure.
Shiba Inu risks losing a crucial support trendline
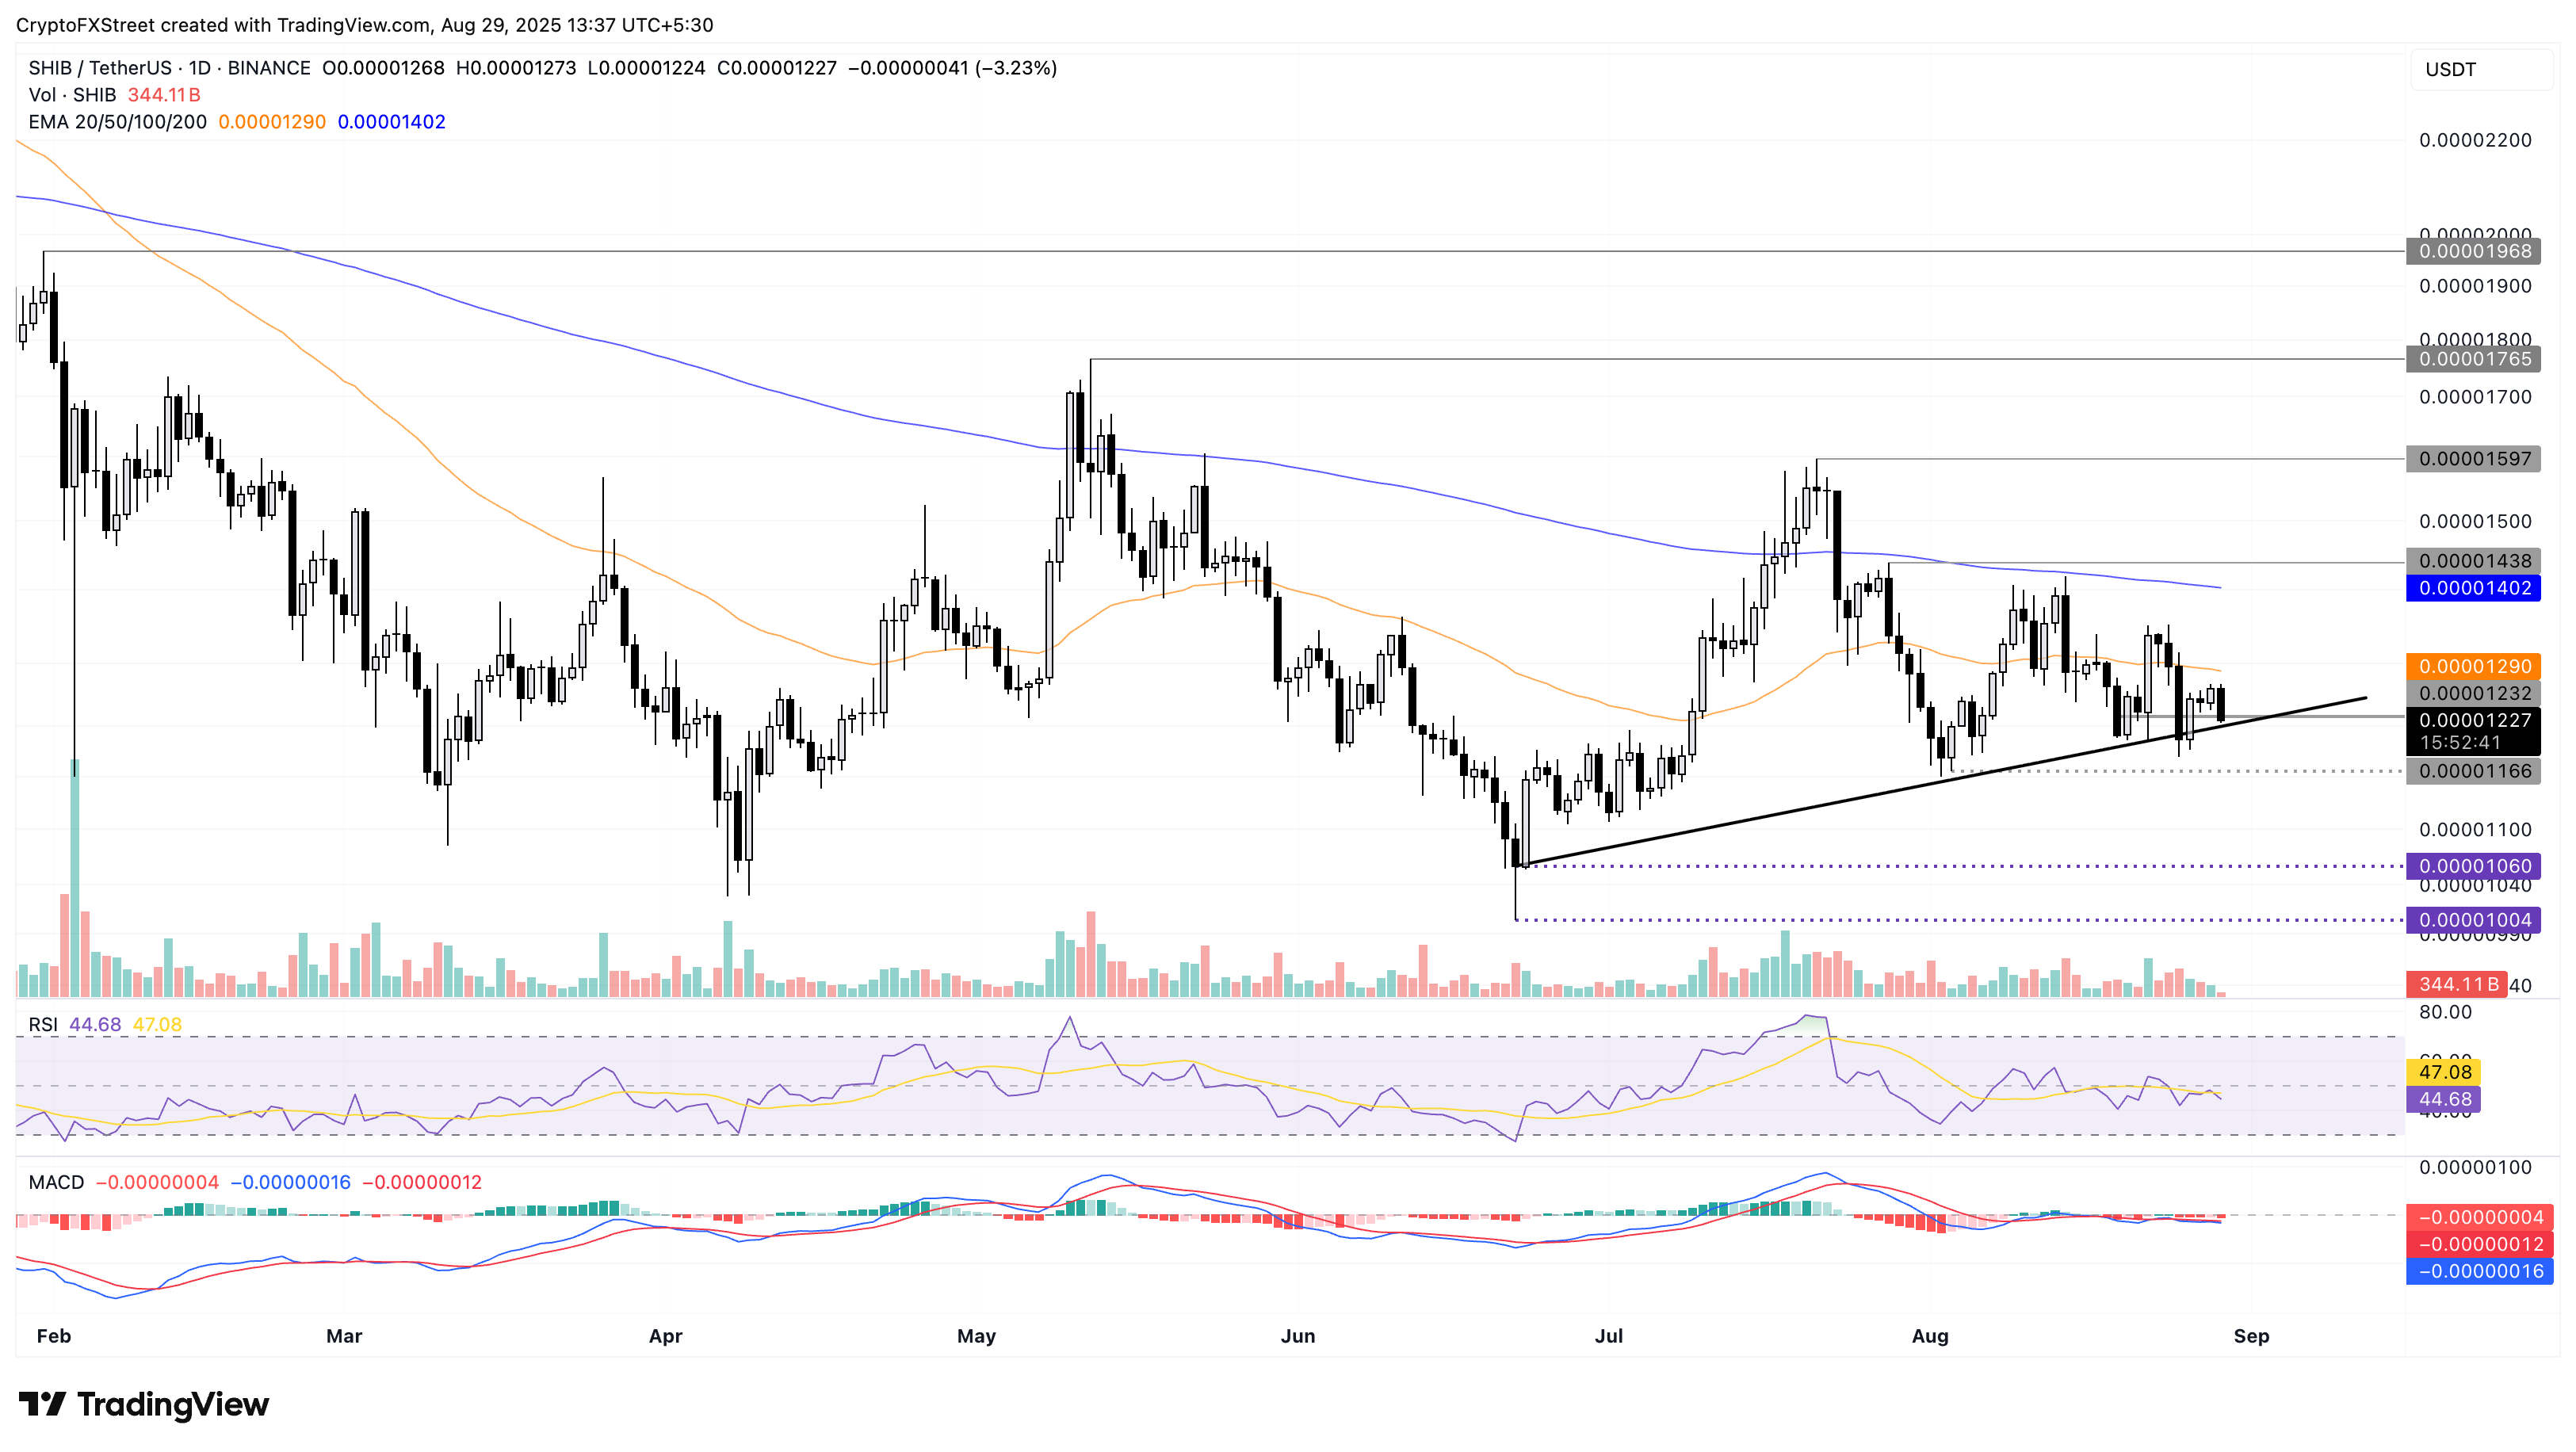
Shiba Inu edges lower by over 3% at press time on Friday, testing a support trendline formed by connecting the June 22 and August 25 closing prices. The meme coin risks a steeper correction if it marks a clean push below this trendline.
This could result in a test of the $0.00001166 low from August 3, while the selling spree could flash $0.00001000 psychological level on bearish radar.
The MACD and its signal line slope downwards under the zero line, indicating bearish momentum at play. Furthermore, the RSI at 44, pointing to the oversold zone, indicates rising bearish momentum.

SHIB/USDT daily price chart.
An optimistic case for SHIB could be a potential reversal from the support trendline to test the 50-day EMA at $0.00001290.
PEPE risks further losses as selling pressure grows
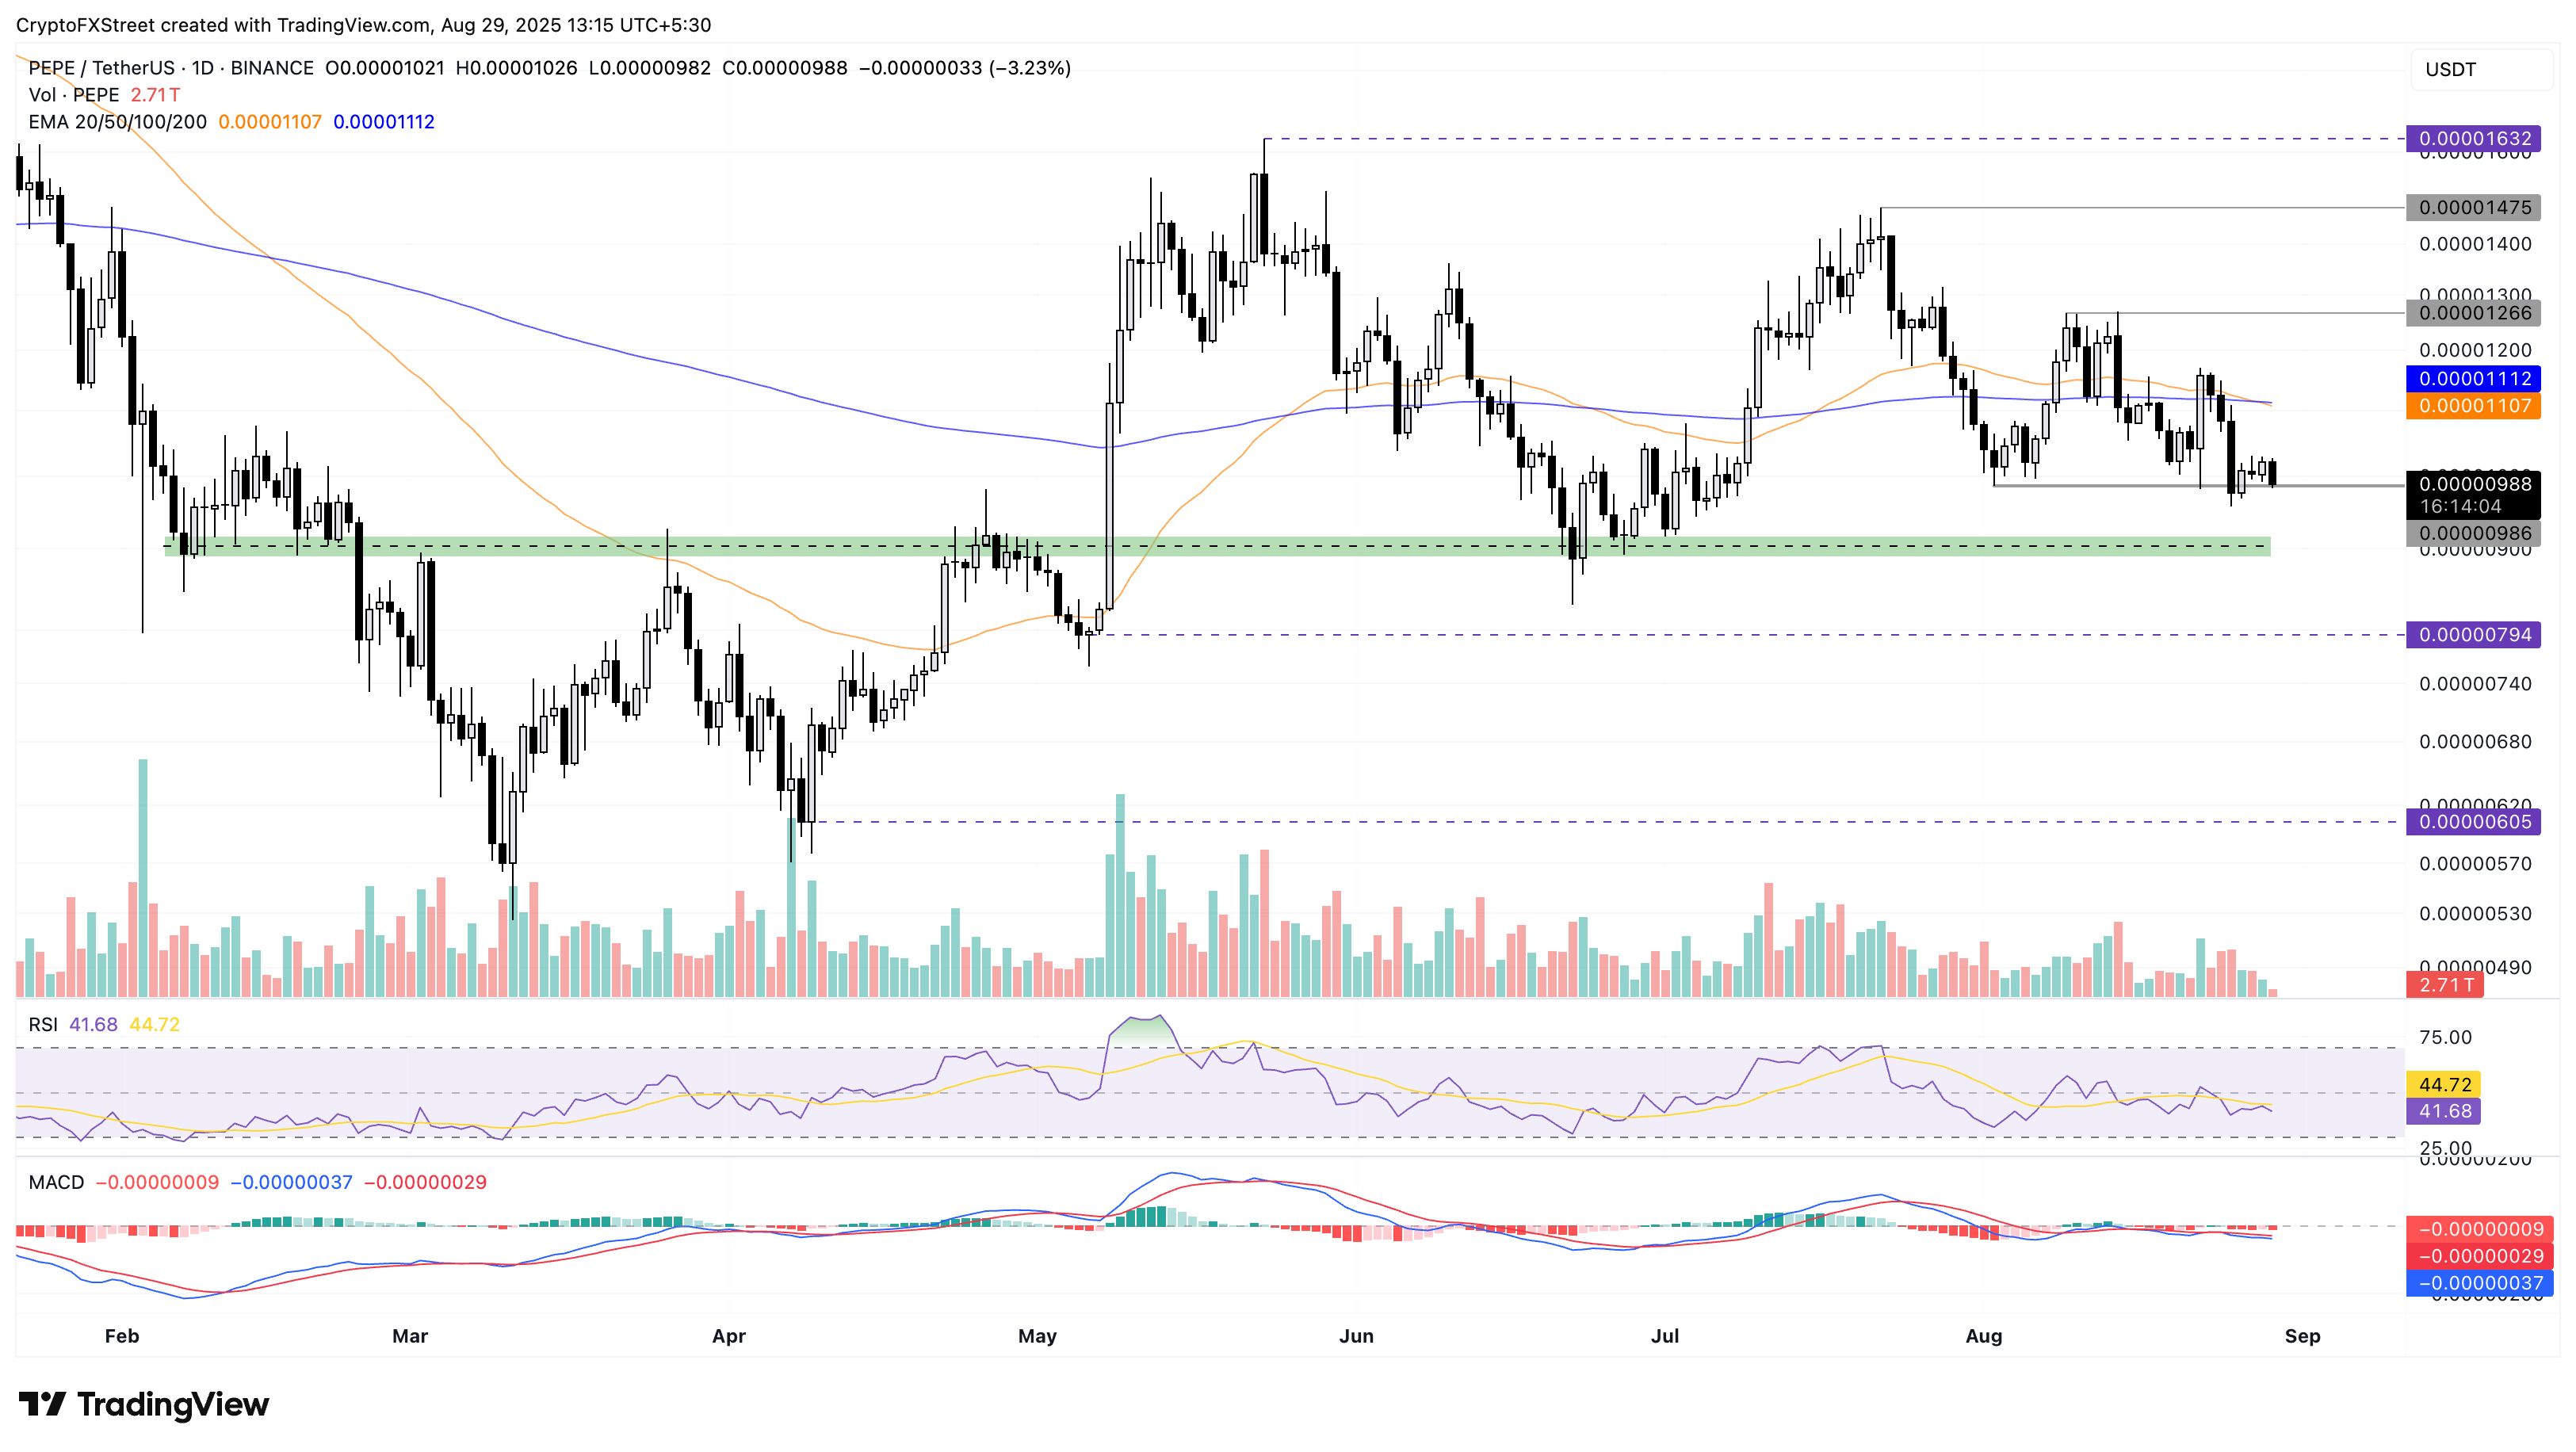
PEPE edges lower by 3% at press time on Friday, failing to extend the 1.79% rise from the previous day. The frog-themed meme coin displays a sell signal as the 50-day EMA falls below the 200-day EMA, indicating a Death Cross pattern. It signals heightened bearish momentum over the short-term trend, which outpaces the larger trend narrative.
Furthermore, the momentum indicators support a bearish bias on the daily chart. The MACD and its signal line trend below the zero line, accompanied by steady red histogram bars, while the RSI is at 41, pointing downward, indicating room for further correction before being oversold.
If PEPE loses the $0.00000988 support level with a decisive daily close, it could retest the $0.00000900 demand zone.

PEPE/USDT daily price chart.
On the contrary, if Pepe rebounds, it could challenge the 50-day EMA at $0.00001107.


