
Skybridge Capital tokenizes $300M funds on Avalanche as AVAX steadies
- Skybridge Capital plans to tokenize its hedge funds, valued at $300 million, on the Avalanche blockchain.
- The AVAX Open Interest grows as bullish bets increase.
- AVAX holds above the 100-day EMA following two consecutive days of losses.
Avalanche (AVAX) recovers by nearly 2% at press time on Wednesday following a bearish start to the week. The recovery is backed by Skybridge Capital, which tokenizes $300 million of its hedge funds on the Avalanche blockchain. Furthermore, an increase in bullish bets in the derivatives market reflects a fresh wave of optimism among AVAX investors.
Skybridge Capital shifts two hedge funds on-chain
Anthony Scaramucci’s Skyrbridge Capital has announced a partnership with Tokeny and its parent company, Apex Group, to migrate its two flagship funds onto the Avalanche blockchain.
"Tokenizing our funds on Avalanche, supported by the technology and operational infrastructure of Tokeny and Apex Group, represents a significant step forward in modernizing the alternative investment landscape," said Anthony Scaramucci, Founder & CEO of SkyBridge Capital.
The Digital Macro Master Fund Ltd. and Legion Strategies Ltd. of Skybridge will leverage the ERC-3643 standard for the on-chain shift. This marks a key milestone for the Avalanche blockchain in expanding its portfolio of tokenized real-world assets.
Bullish bets and Open Interest increase for AVAX
CoinGlass data shows that the AVAX Open Interest (OI) has increased by over 0.50% in the last 24 hours, reaching $740.78 million. Typically, an increase in OI translates to increased capital inflows as investors gain confidence.
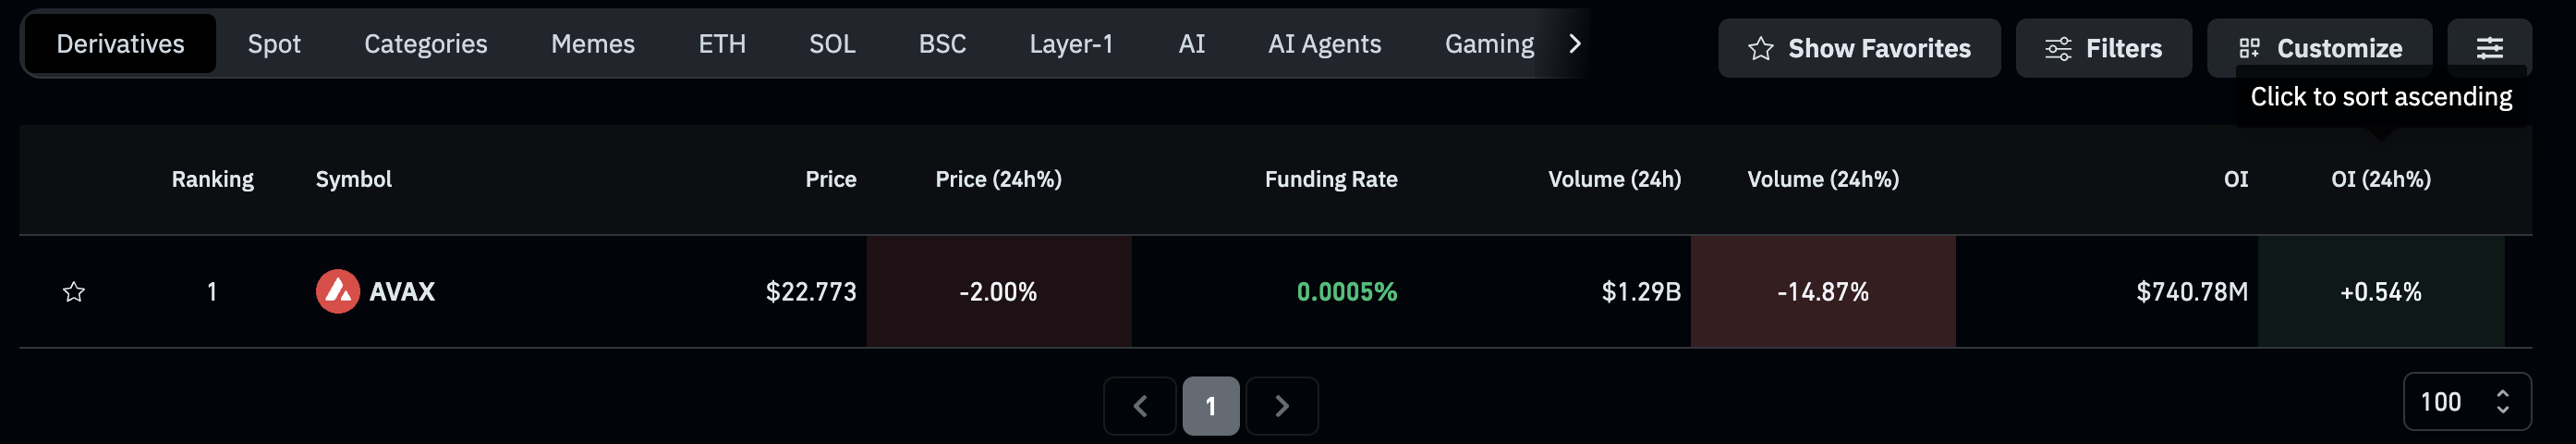
AVAX derivatives. Source: Coinglass
Adding credence to increased confidence, the bullish bets over the last 24 hours have increased in AVAX derivatives. The long-to-short ratio is at 1.004, up from 0.9312, as long positions surged to 50.1% from 48.22% on Tuesday. Despite the surge, the active long and short positions are almost equal in number, maintaining a neutral stance.
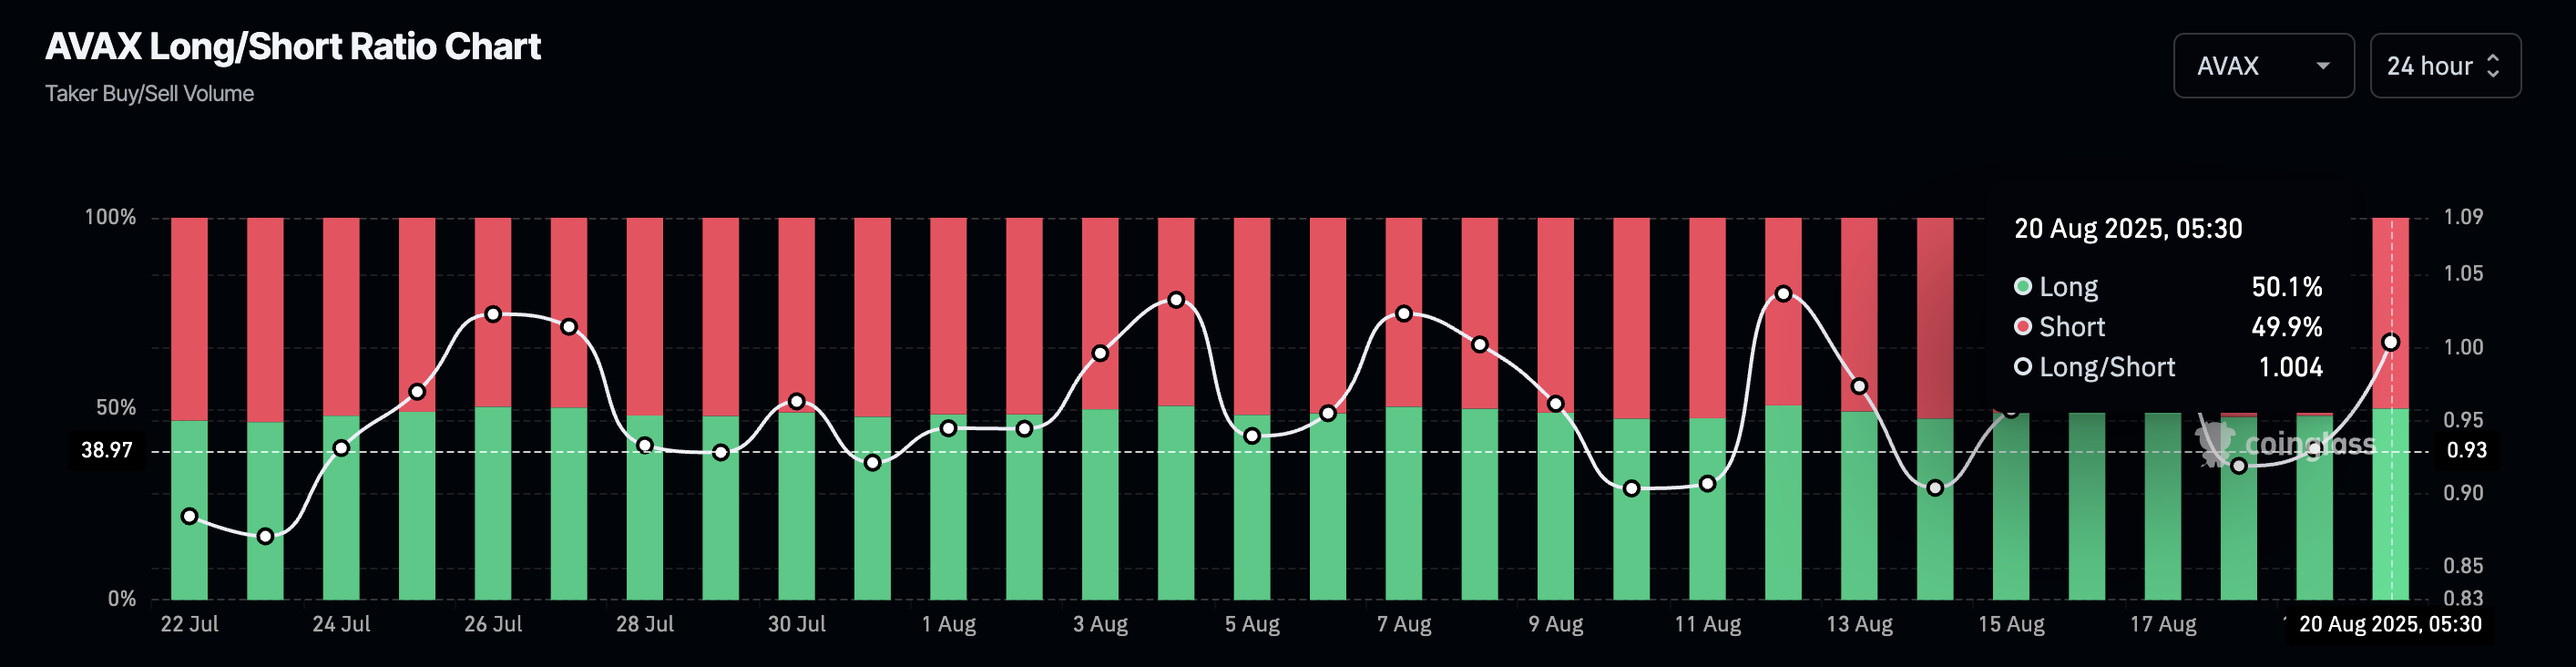
AVAX long/short ratio chart. Source: Coinglass
Avalanche at dreadlocks with EMAs
Avalanche failed to surpass the overhead supply zone at $25.50 on Sunday, aligning with the 38.2% Fibonacci retracement level, which is drawn from $53.98 on December 8 to $16.04 on April 6. This resulted in two days of losses, accounting for nearly 11%.
At the time of writing, Avalanche trades at $22.77 on Wednesday as it bounces off the 100-day Exponential Moving Average (EMA) at $22.26. The recovery challenges the 50-day EMA at $22.71, with bulls targeting the 200-day EMA at $23.39. The close moving average lines act as short-term support and resistance as the price action grows volatile.
The momentum indicators hold a pessimistic view of the situation. On the daily chart, the Moving Average Convergence Divergence (MACD) crossed below its signal line on Tuesday, triggering a sell signal as bearish momentum resurfaces.
Additionally, the Relative Strength Index (RSI) reads 47 on the same chart, with an almost parallel movement to the halfway line, indicating momentum at a deuce.
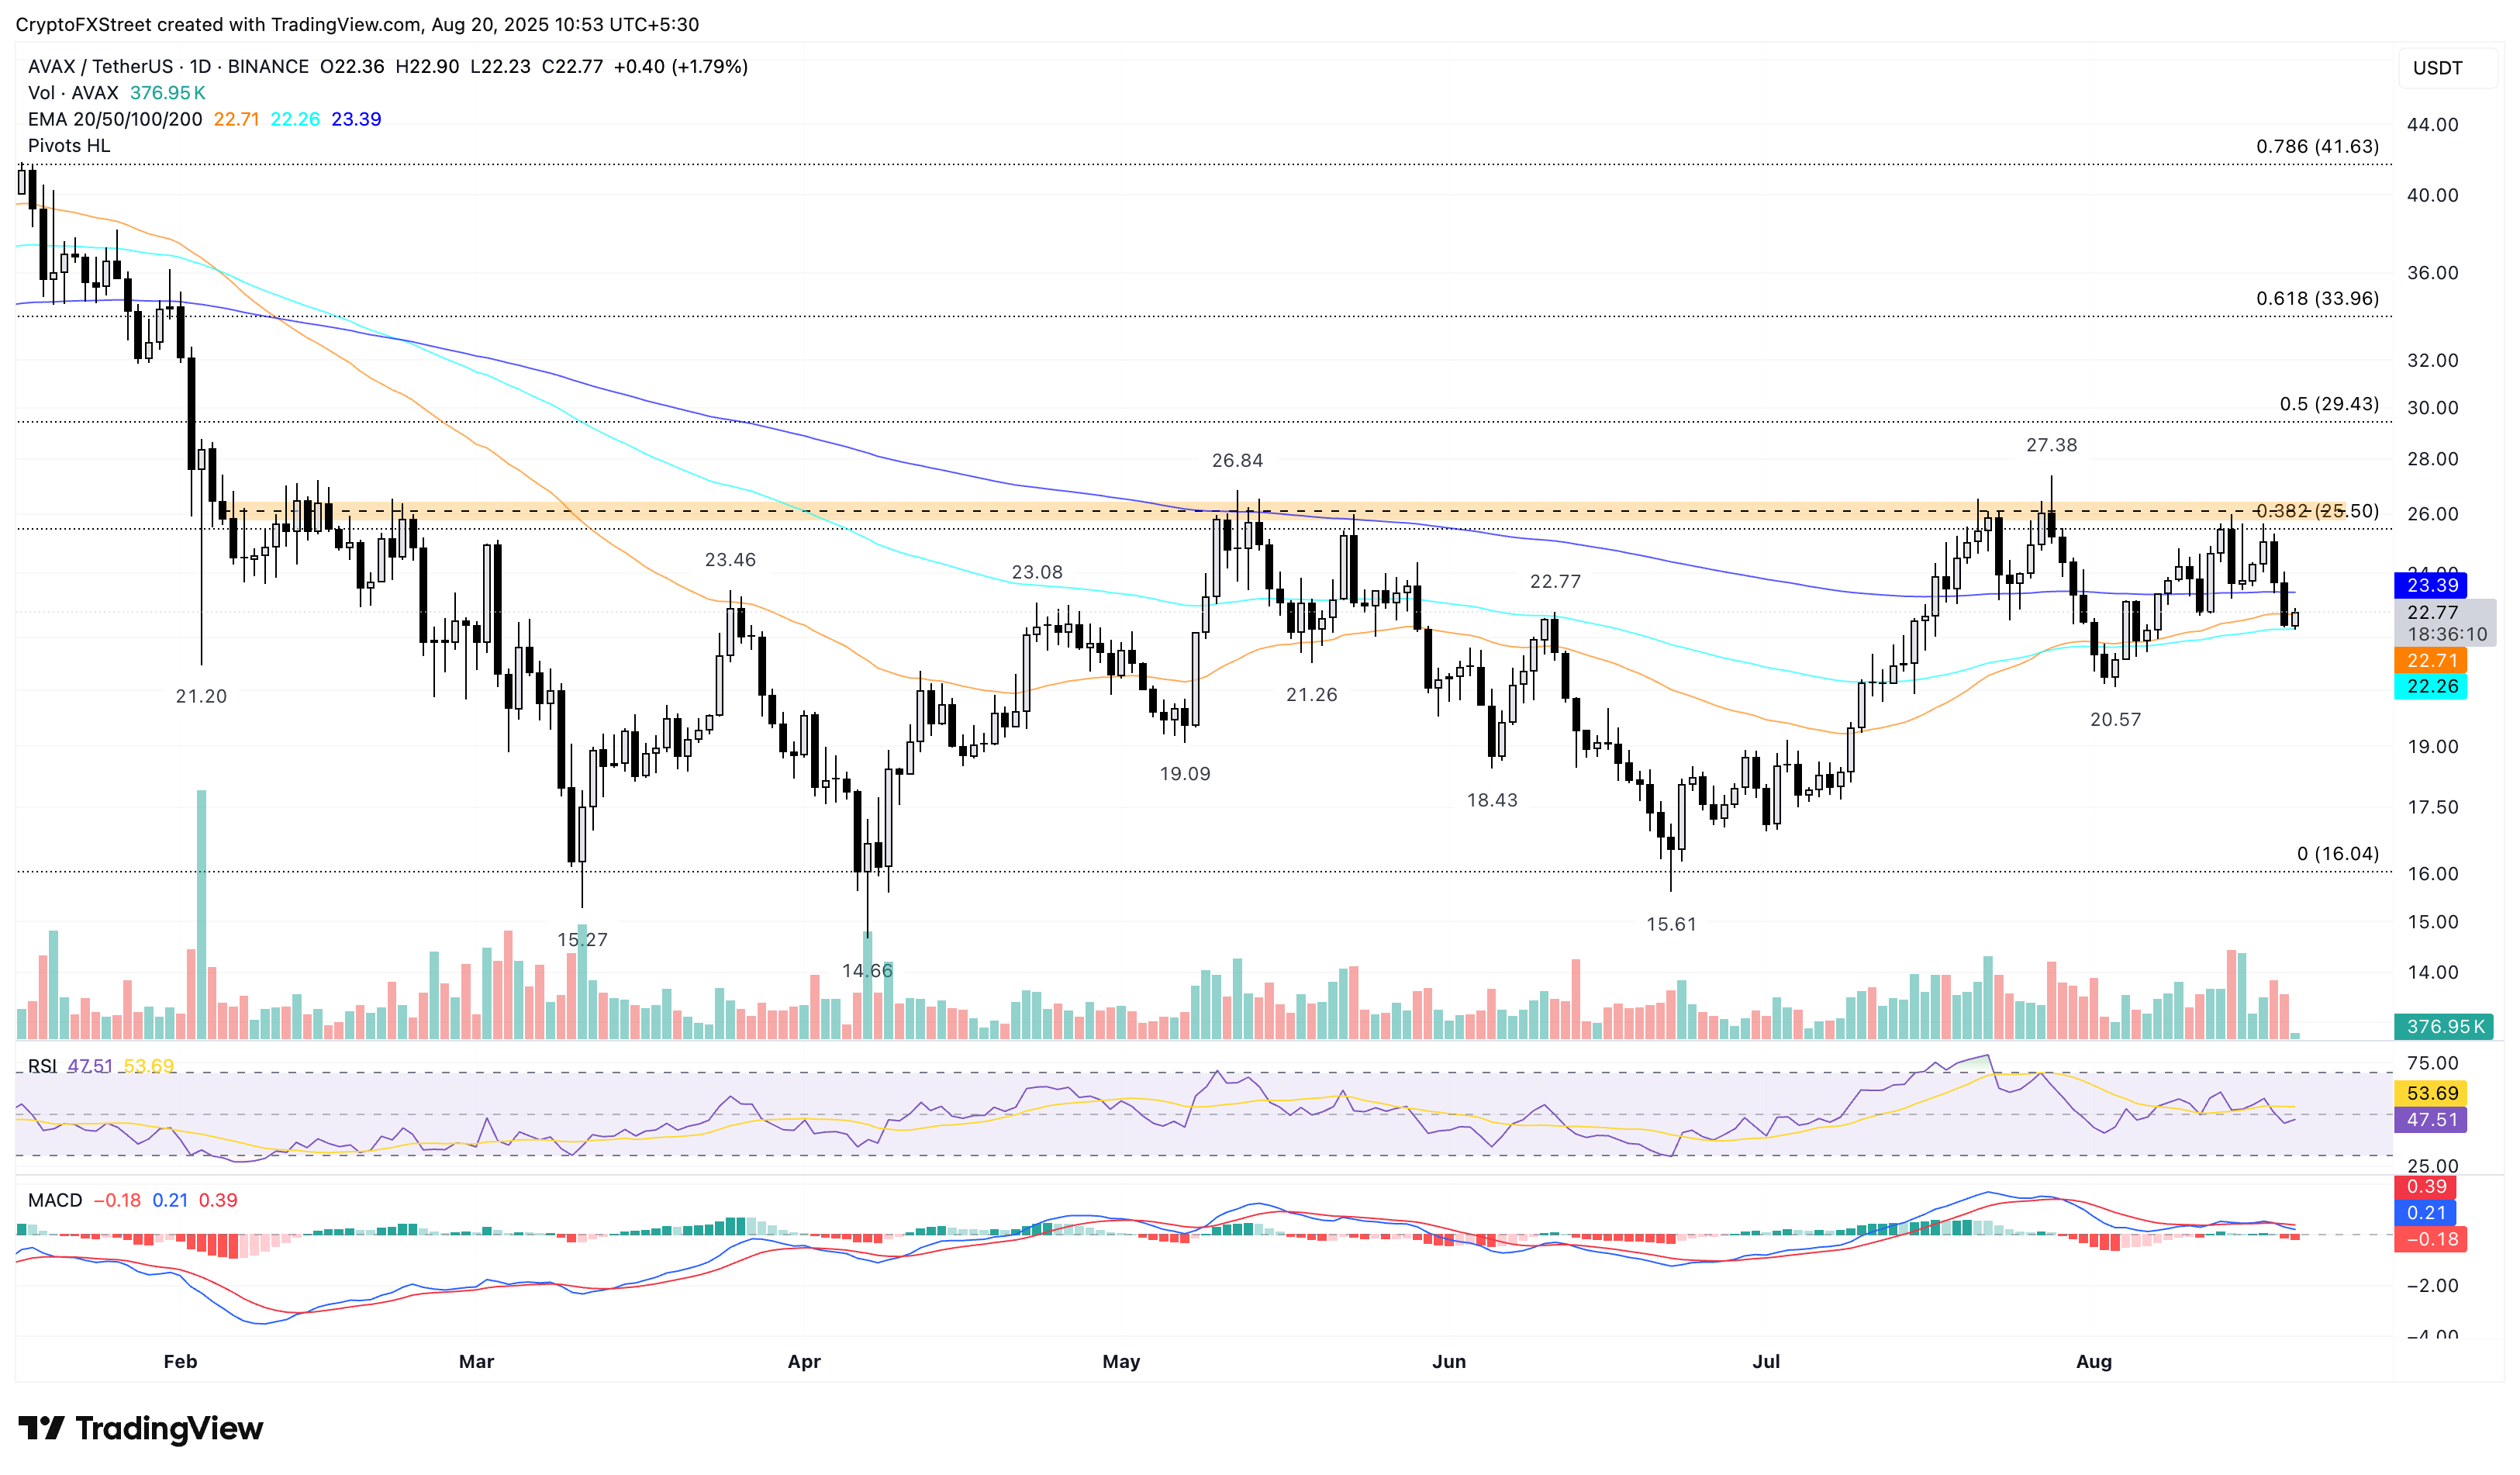
AVAX/USDT daily price chart.
Looking down, a daily close below the 100-day EMA at $22.26 could extend the decline to the August 3 pivot point of $20.57.
Bài viết đề xuất


