
Cardano Price Forecast: ADA bulls set $0.86 target as network activity, Open Interest increases
- Cardano price nears $0.80 as breakout rally from the channel gains traction.
- On-chain data points to increased user activity on the Cardano network.
- ADA Open Interest increases by 12%, indicating greater confidence among traders.
Cardano (ADA) is holding near the $0.80 level at press time on Friday, following a 6.22% gain from Thursday, as trader interest increases, raising the Open Interest by 12% in the last 24 hours. The on-chain data support the bullish outlook, as the number of active addresses and the ratio of transaction volume in profit to loss increase.
Cardano network activity signals rising demand
Santiment data shows the 24-hour Unique Active Addresses (UAA) count rising to 30.9K at press time on Friday, up from 29.6K addresses on Thursday. An increase in UAA transactions on the Cardano network indicates increased activity and usage. It is worth noting that in relation to the rising ADA prices, the rise in active addresses signals increased interest.
The ratio of on-chain transaction volume in profit to loss has surged to 4.808, up from 1.790 on Thursday, indicating more transactions occurring at prices higher than the price of the last moved token. This signals an increase in network and token demand.
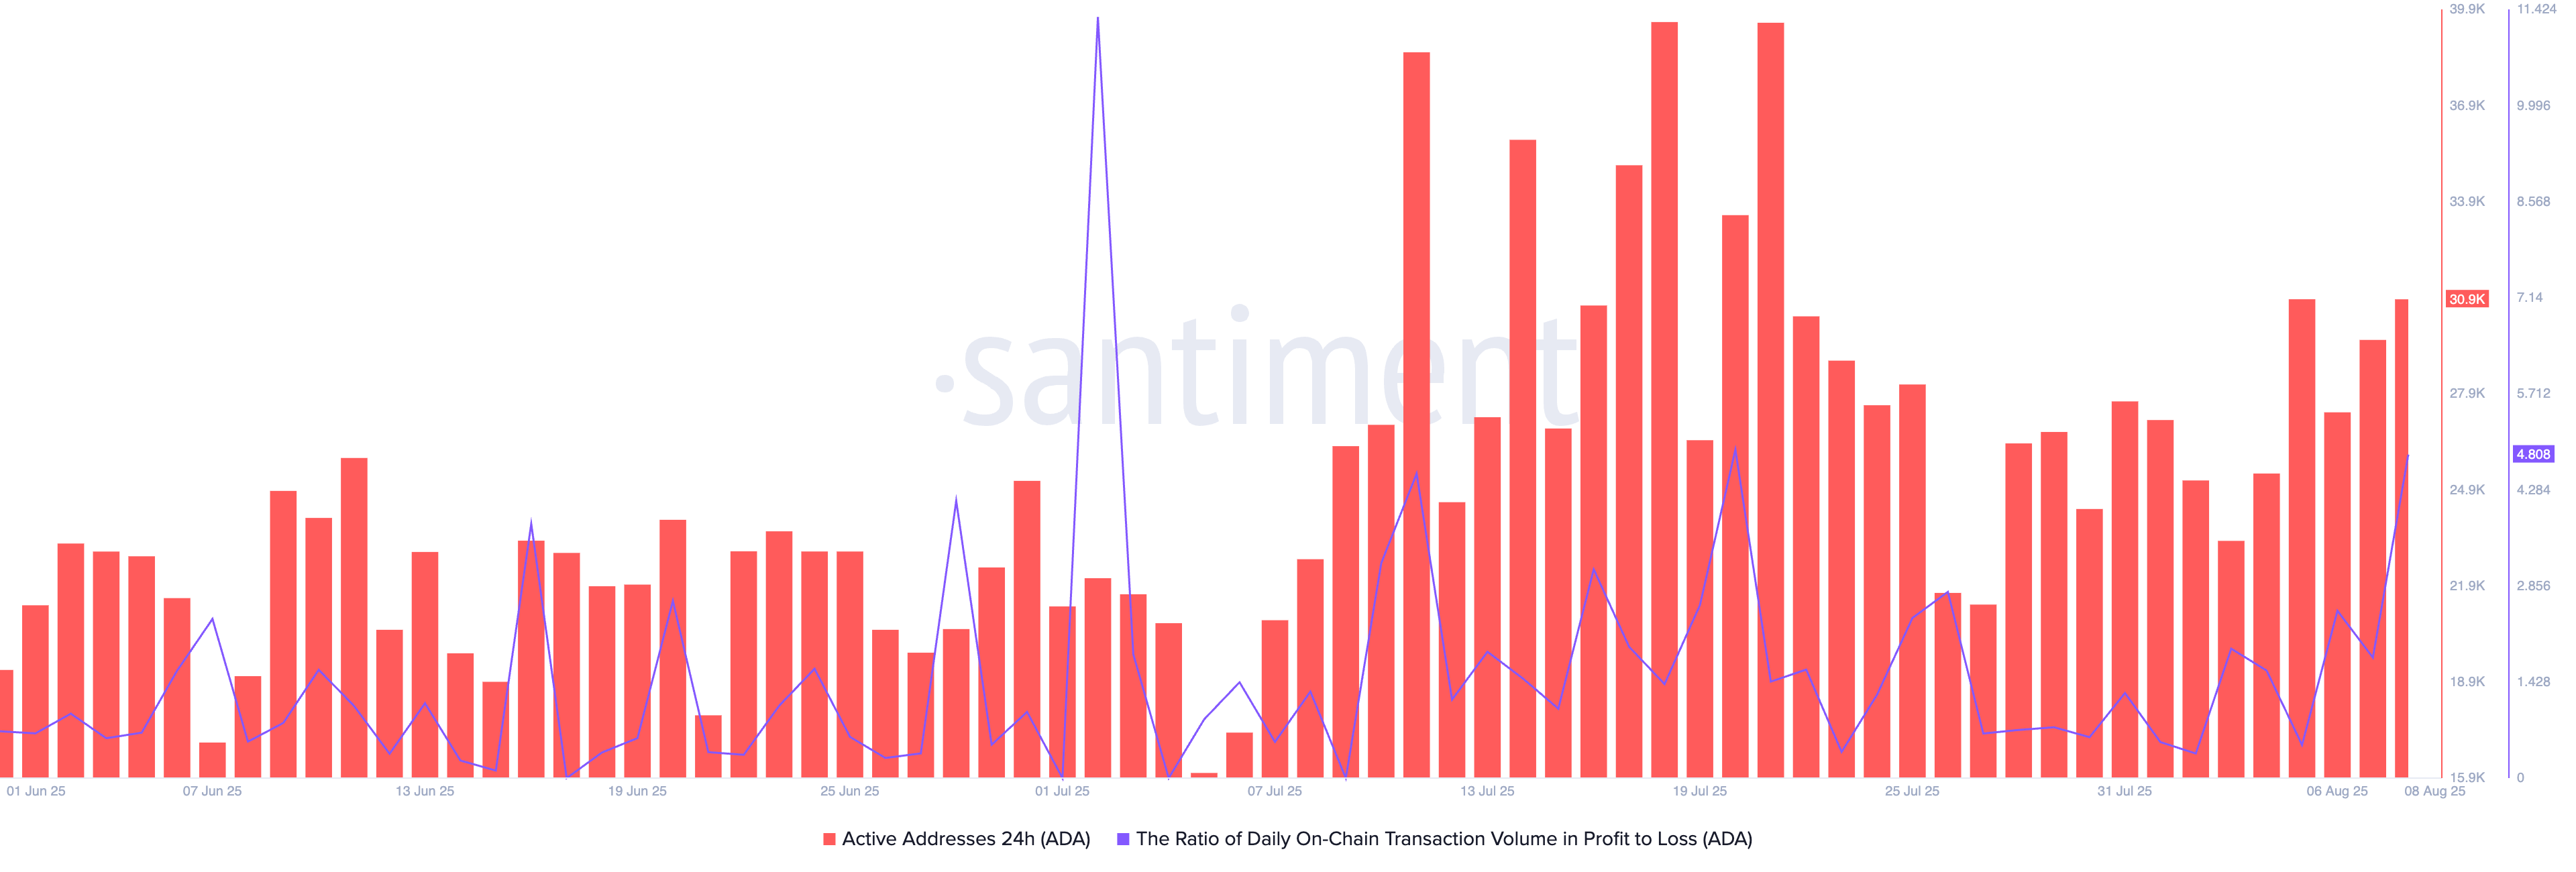
Cardano network metrics. Source: Santiment
ADA derivatives data flash optimistic signals
CoinGlass data indicates a 12% increase in ADA Open Interest over the last 24 hours, reaching $1.43 billion. An increase in OI often relates to a surge in capital inflow, which could be bullish if it aligns with a rise in funding rate, as previously reported by FXStreet. The OI-weighted funding rate stands at 0.0107%, up from 0.0085% on Thursday, indicating a buy-side dominance.
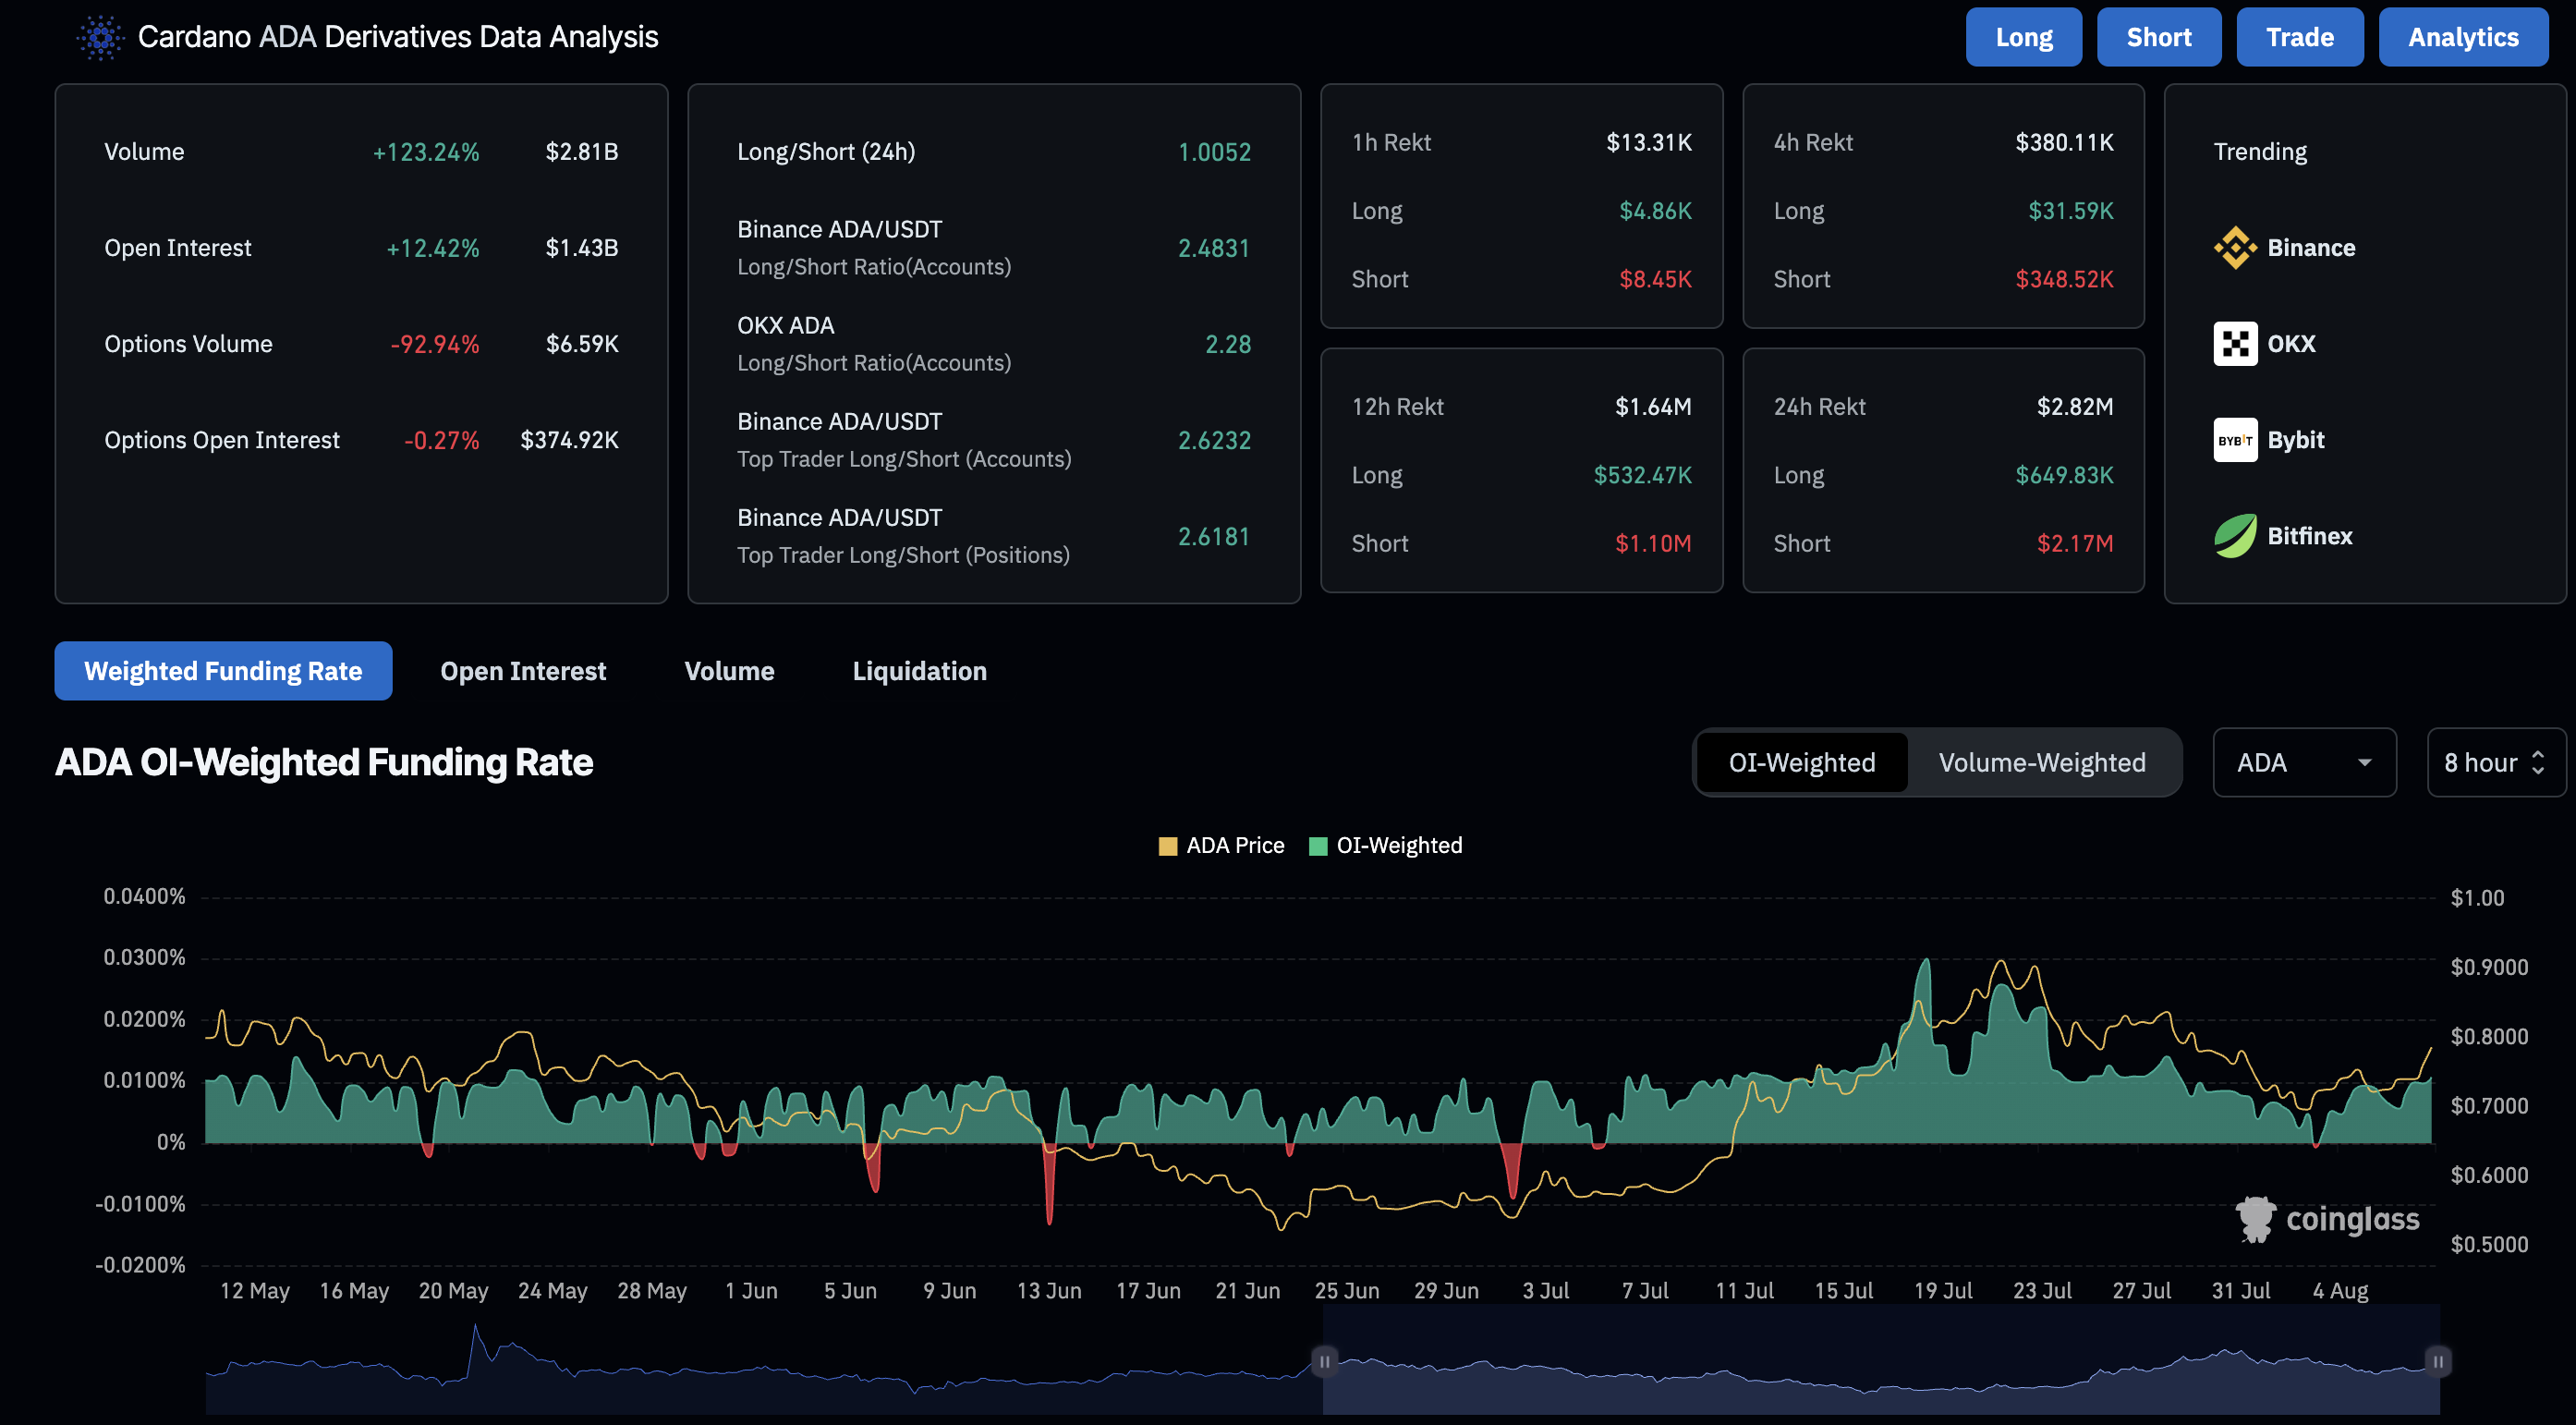
ADA derivatives data. Source: Coinglass
Cardano eyes further gains with channel breakout
Cardano breaks out of a falling channel pattern on the 4-hour chart (shared below) to extend its recovery run. ADA trades at $0.7953 at press time on Friday, after losing steam from its peak of $0.8012.
The channel breakout rally holds above $0.7854, a resistance-turned-support level, with bulls targeting the $0.8599 level, last tested on July 23.
The Moving Average Convergence Divergence (MACD) indicator indicates rising bullish momentum, characterized by uptrending average lines and green histogram bars. Still, the Relative Strength Index (RSI) is flattening at 69, near the overbought boundary, which warns investors to remain cautious as buying pressure reaches saturation levels.
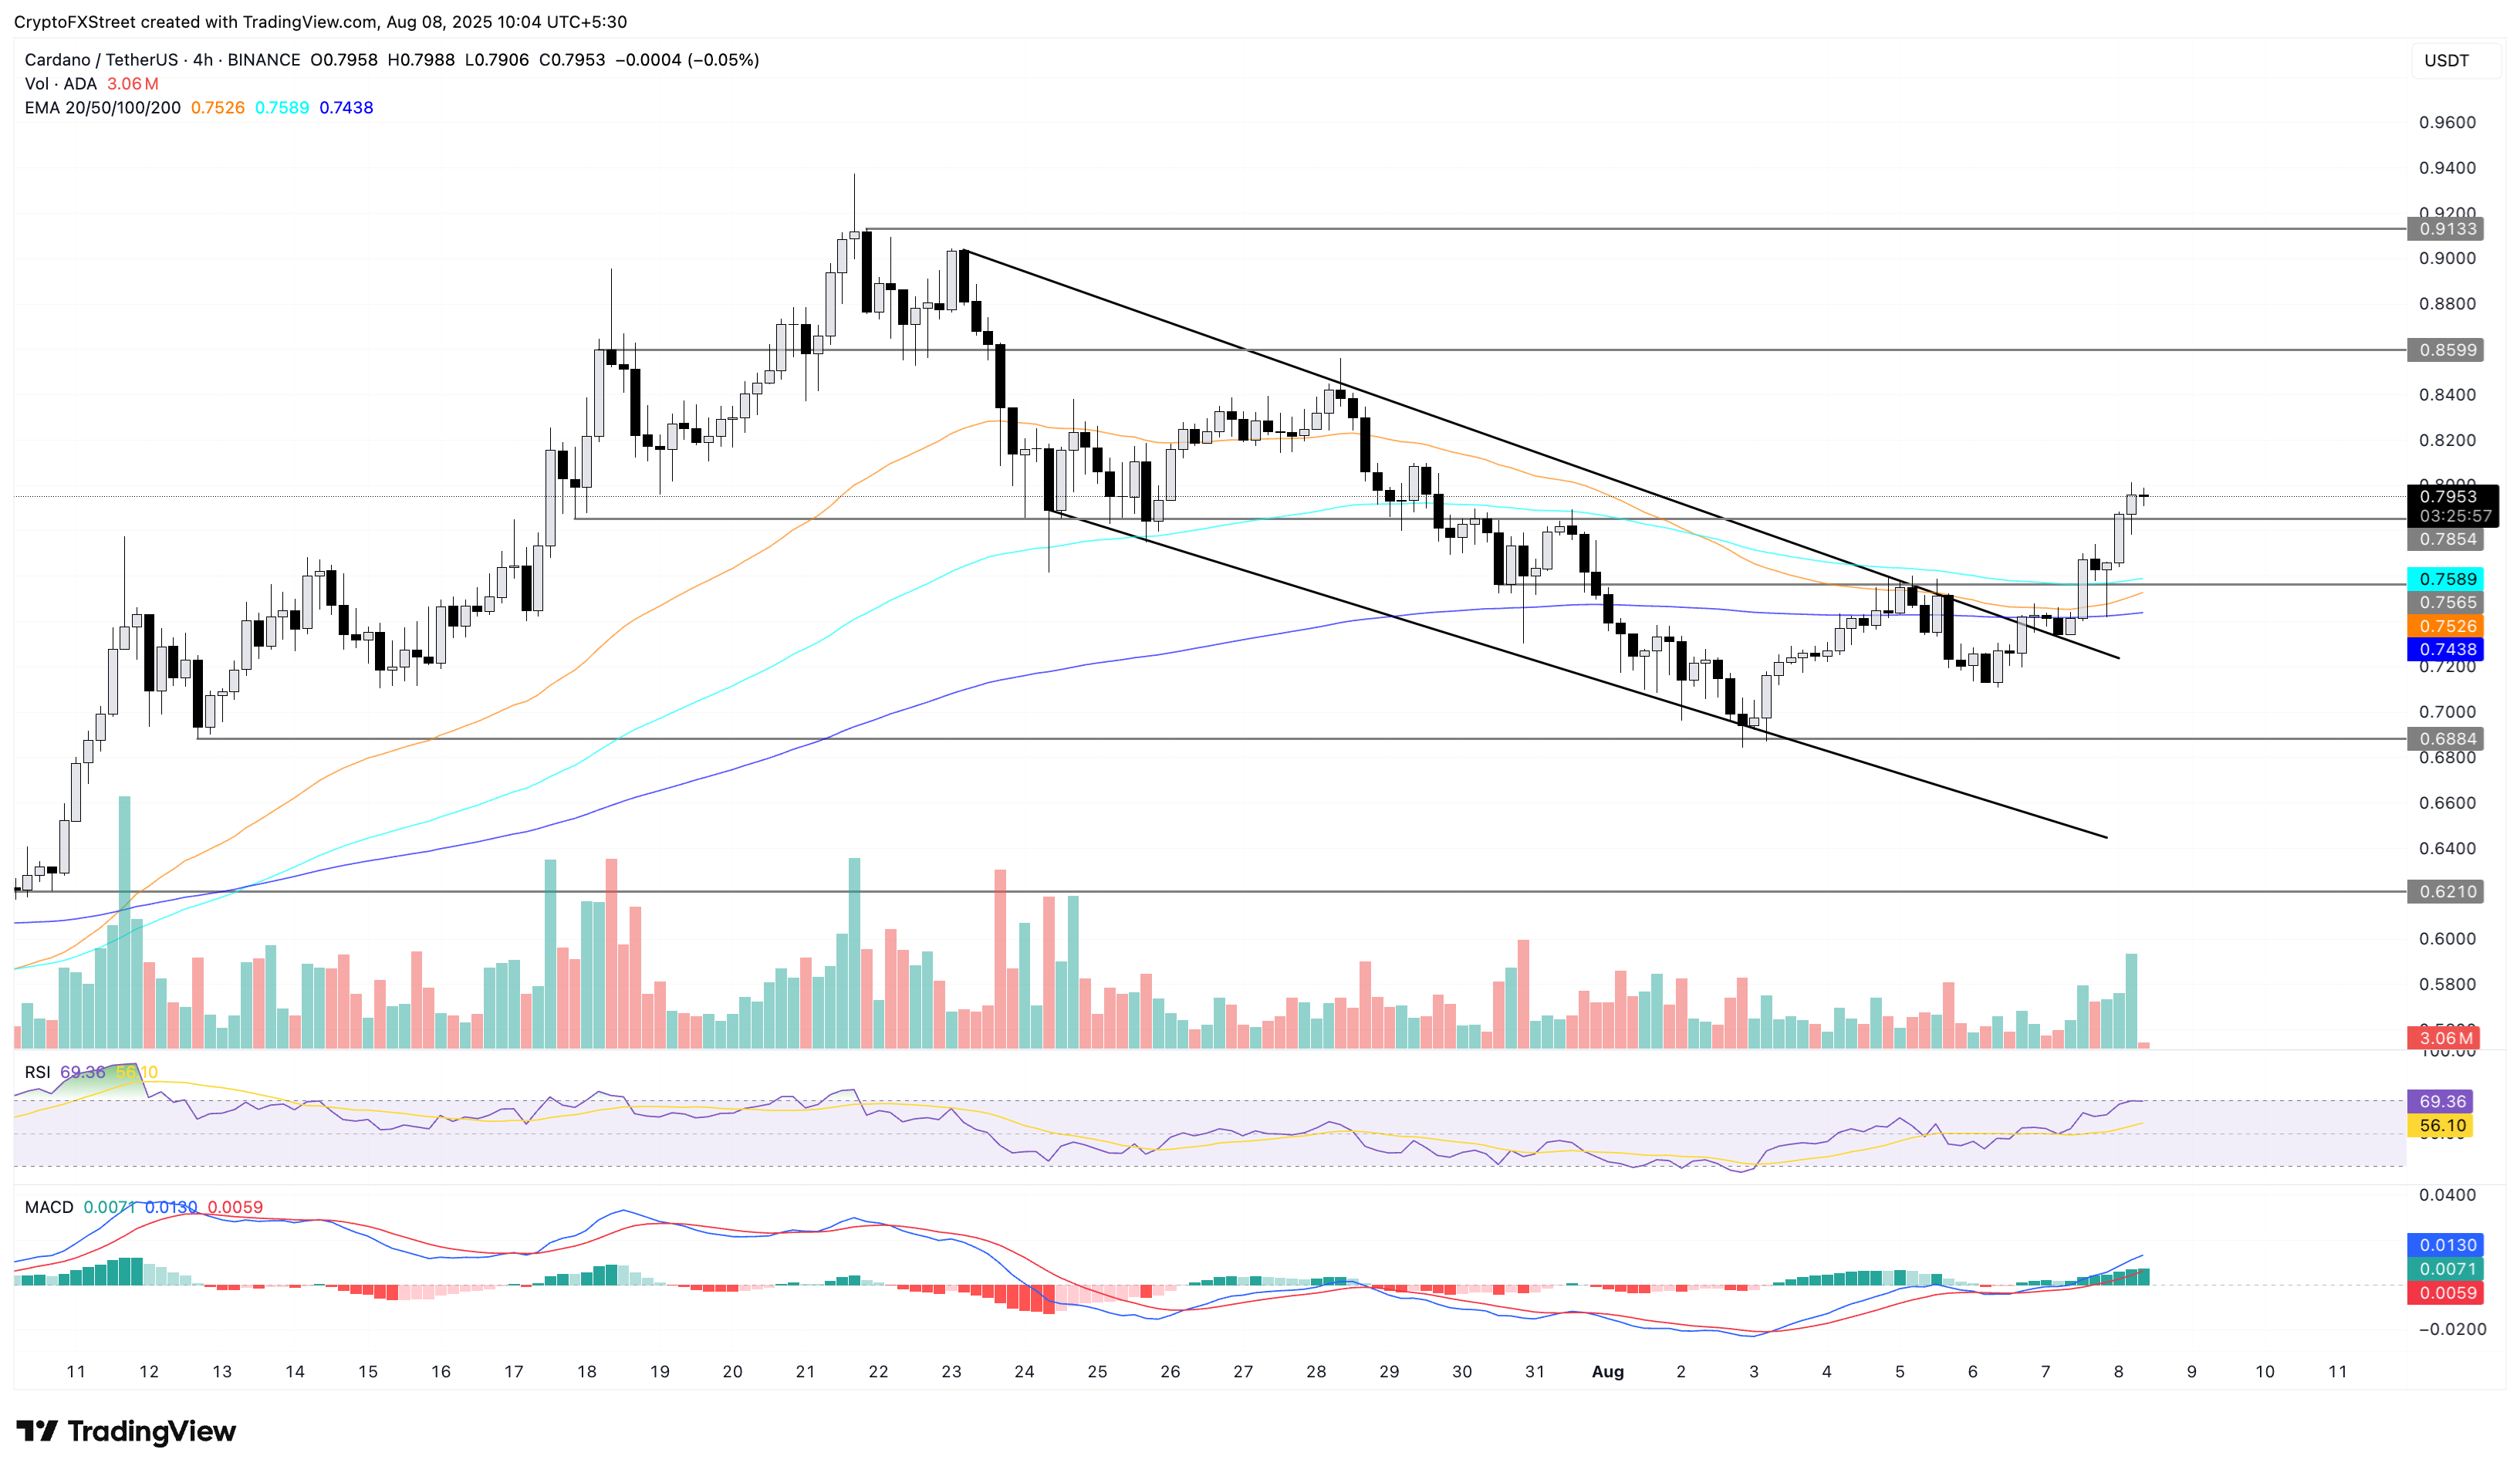
ADA/USDT daily price chart.
On the flipside, a reversal below the $0.7854 level could extend the decline to the 100-period Exponential Moving Average at $0.7589.
Bài viết đề xuất


