
Pi Network Price Forecast: Minor recovery teases trend reversal amid GenAI claims, Pi2Day
- Pi Network edges higher on Tuesday, holding above a crucial psychological and trendline support.
- The Pi Core team teases a potential Generative AI feature to be announced on Pi2Day, June 28.
- The technical outlook shares a bullish inclination ahead of the July PI token unlock, the highest expected until October 2027.
Pi Network (PI) edges lower by 1% at press time on Tuesday, following a 6.68% rise on Monday. With the minor recovery earlier this week, PI holds above a crucial psychological and trendline support amid growing buzz about potential Generative Artificial Intelligence (GenAI) features, to be unveiled on June 28.
Buzz growing around Pi Network’s GenAI feature
Pi Core team fuels the buzz around GenAI and its potential relationship with the Pi Network. The claims are based on Nicolas Kokkalis, one of the founders of Pi Network, joining the GenAI panel at Consensus 2025 held by Coindesk between May 14 and May 16.
Notably, on the first day of the Consensus event, Pi Network dropped by 27%, igniting the ongoing correction. PI is down nearly 70% from its highest trading price in May, at $1.67.

The post reveals the potential GenAI features or utilization within the network to be unveiled on June 28, celebrated as Pi2Day by the Pi Network community.
Potential hype creation before PI token unlock
PiScan data shows 268.4 million PI tokens ready to be unlocked throughout July, the highest monthly unlock until October 2027. Typically, the token unlocks often lead to increased supply pressure if the investors’ confidence is low.
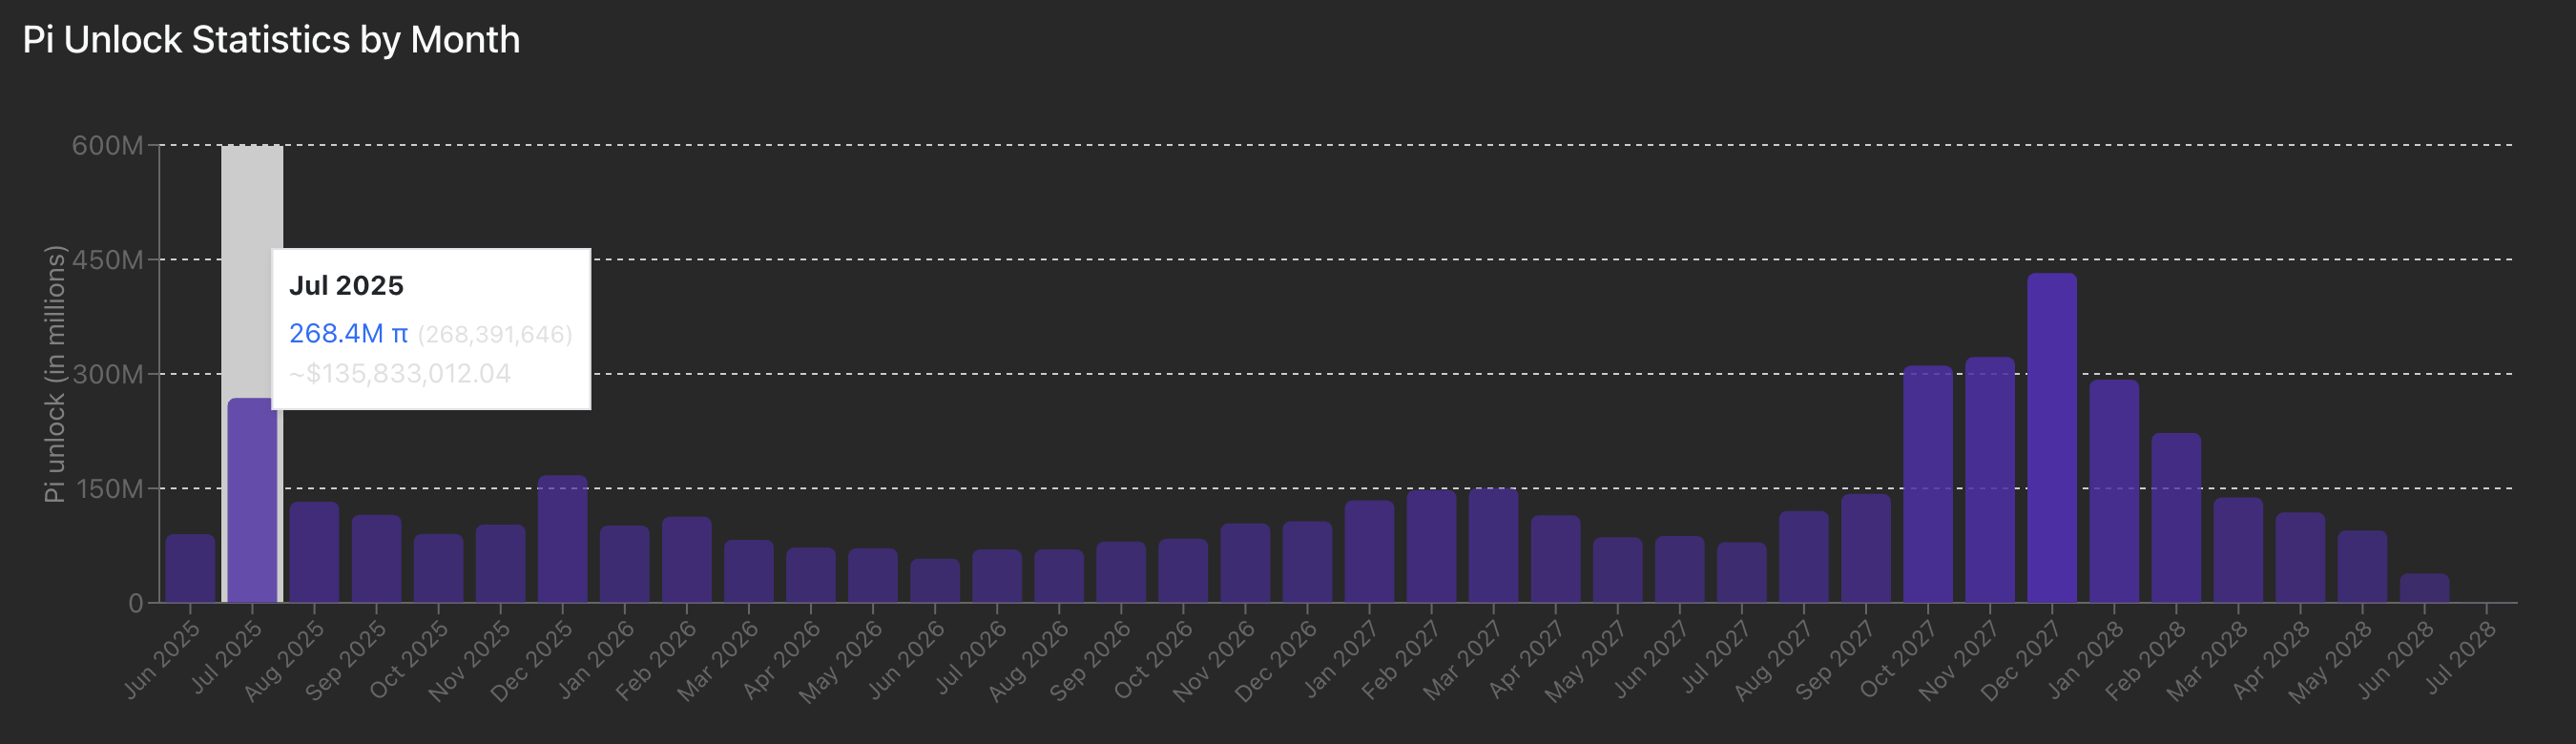
PI unlock statistics. Source: PiScan
As the risk-off sentiment spreads across the broader cryptocurrency market, Pi Network may experience a surge in bearish momentum. According to a Pi Network Pioneer, the vague claims of Pi Network’s linkage to a GenAI feature are a hype creation to cover a broken roadmap, serving as another smoke screen.

Pi Network’s recovery nears trendline breakout
Pi Network trades in the red by 1% at press time on Tuesday, following a 7% recovery on Monday. With the recovery, PI holds above a crucial short-term support trendline formed by the swing lows on May 17, May 31, and June 18.
To reinstate a bullish recovery trend, PI must surpass the overhead trendline with a closing above $0.55, aligning with the low on April 29. In such a case, Pi Network’s reversal rally could rise towards the previous week's high at $0.60.
The Moving Average Convergence/Divergence (MACD) indicator shows that the MACD and signal lines are approaching a crossover, suggesting a potential trend reversal. Investors could consider the fresh wave of green histogram bars rising from the zero line upon crossover as a possible buy signal.
The Relative Strength Index (RSI) suggests a bounce back from bearish levels, indicating a decline in selling pressure.
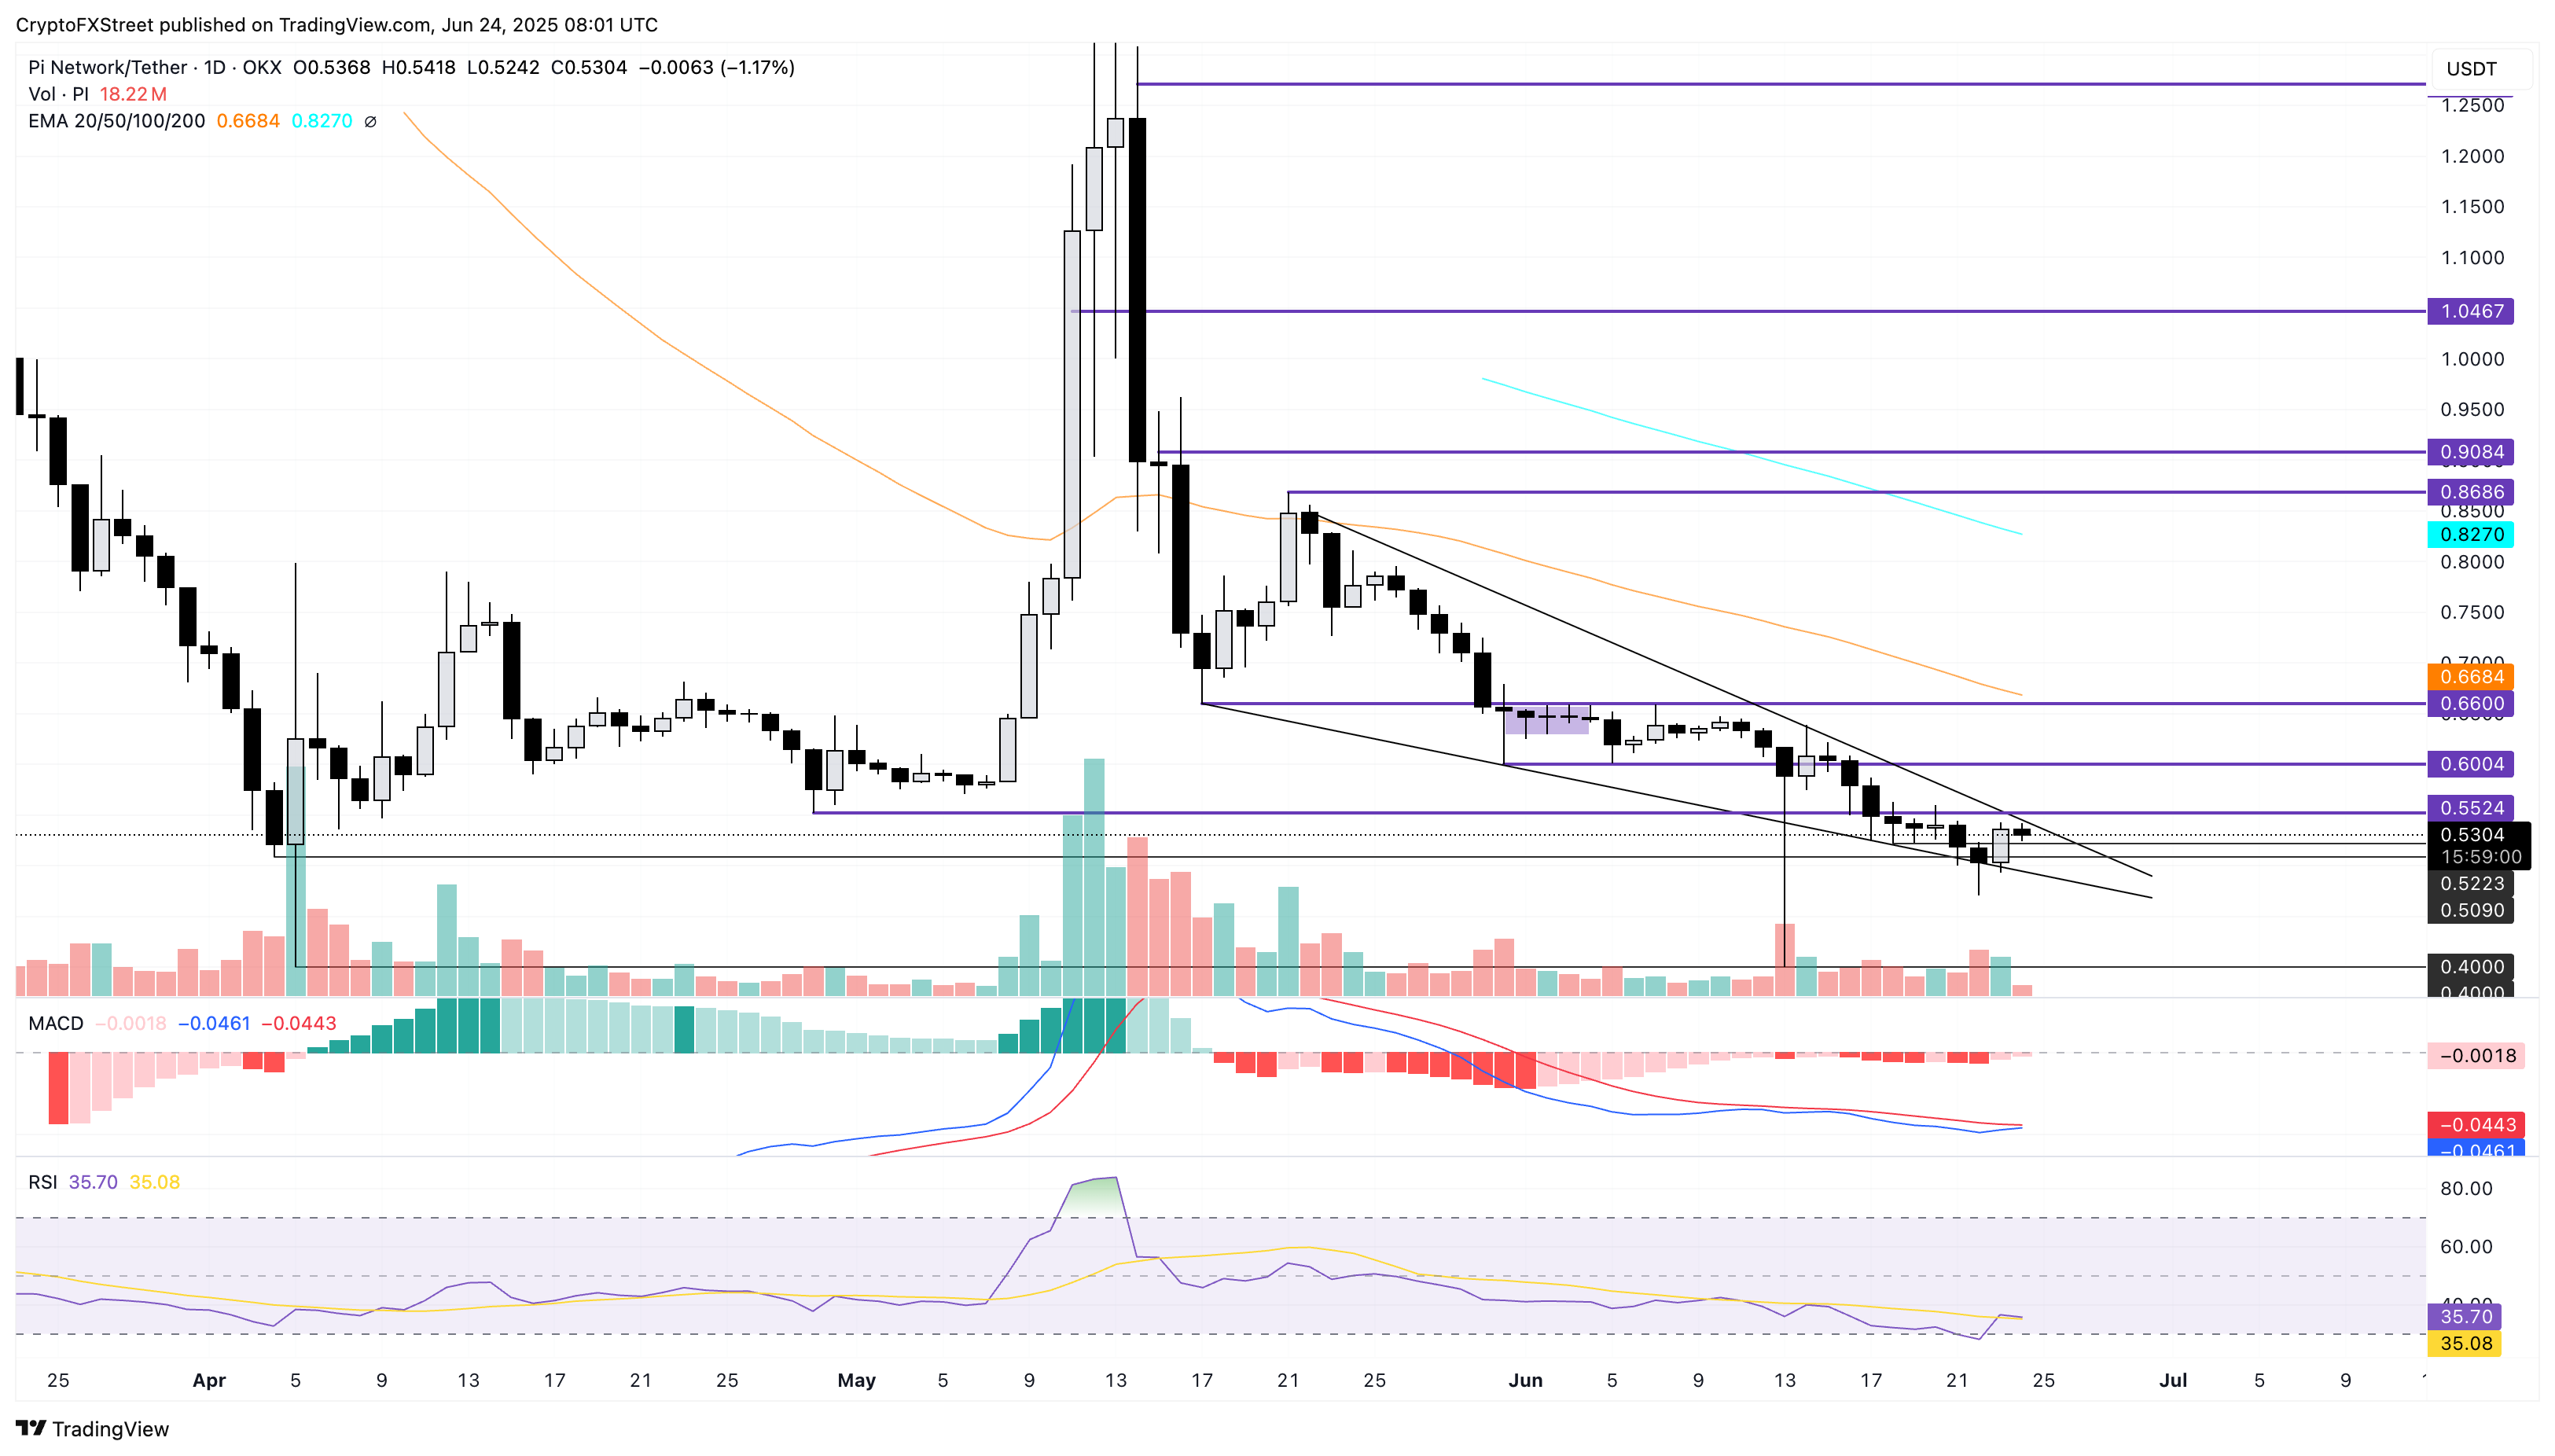
PI/USDT daily price chart.
However, a closing below the lower support trendline at $0.4935 (weekly low) could potentially extend the declining trend towards the $0.40 round figure, last tested on June 13.
Bài viết đề xuất


