
SPX6900 meme coin soars more than 30% in a week as open interest, number of large holders surge
- SPX6900 trades in green on Wednesday following a rally of over 30% in the last seven days.
- SPX open interest increases sharply and the number of large-wallet holders also rises, supporting the bullish outlook.
- SPX6900 could overtake FLOKI’s market capitalization in the near term if the rally continues.
SPX6900 (SPX) meme coin trades in green on Wednesday following a surge of over 30% in the last seven days. This price rally was supported by its on-chain metrics, with open interest surging and holders’ accumulation also on the rise. As bullish sentiment strengthens for SPX, speculation is growing that the meme coin could overtake FLOKI’s (FLOKI) market capitalization in the near term.
SPX6900 on-chain metrics show bullish bias
Coinglass’ data shows that the futures’ Open Interest (OI) in SPX at exchanges rose to $65.19 million on Wednesday from $45.95 million on Tuesday, the highest level since January 19. An increasing OI represents new or additional money entering the market and new buying, which could fuel the current SPX6900 meme coin price rally.
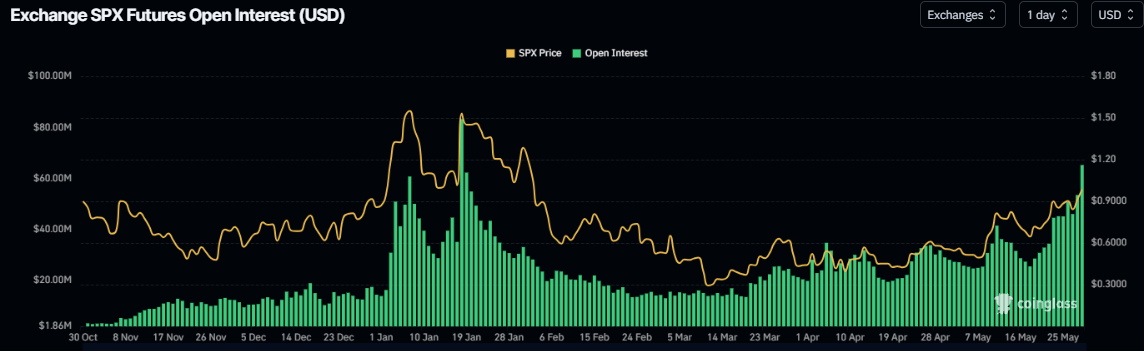
SPX6900 open interest chart. Source: Coinglass
Santiment’s Supply Distribution data projects also support the bullish outlook, as the number of large-wallet holders is rising.
The metric indicates that the whales holding between 100,000 to 1 million (red line), and 10 million to 100 million (blue line) SPX tokens have increased from Saturday to Wednesday. During the same period, whales holding tokens between 1 million to 10 million (yellow line) fell.
This development indicates that the first set of whales has seized the opportunity to accumulate SPX at a discount. In contrast, the second cohort of whales (yellow line) fall prey to a capitulation event. Stalk Chain data shows that the SPX tokens were the most bought meme coin in the last 24 hours.
 [12-1748422024924.54.55, 28 May, 2025].png)
SPX Supply distribution chart. Source: Sentiment
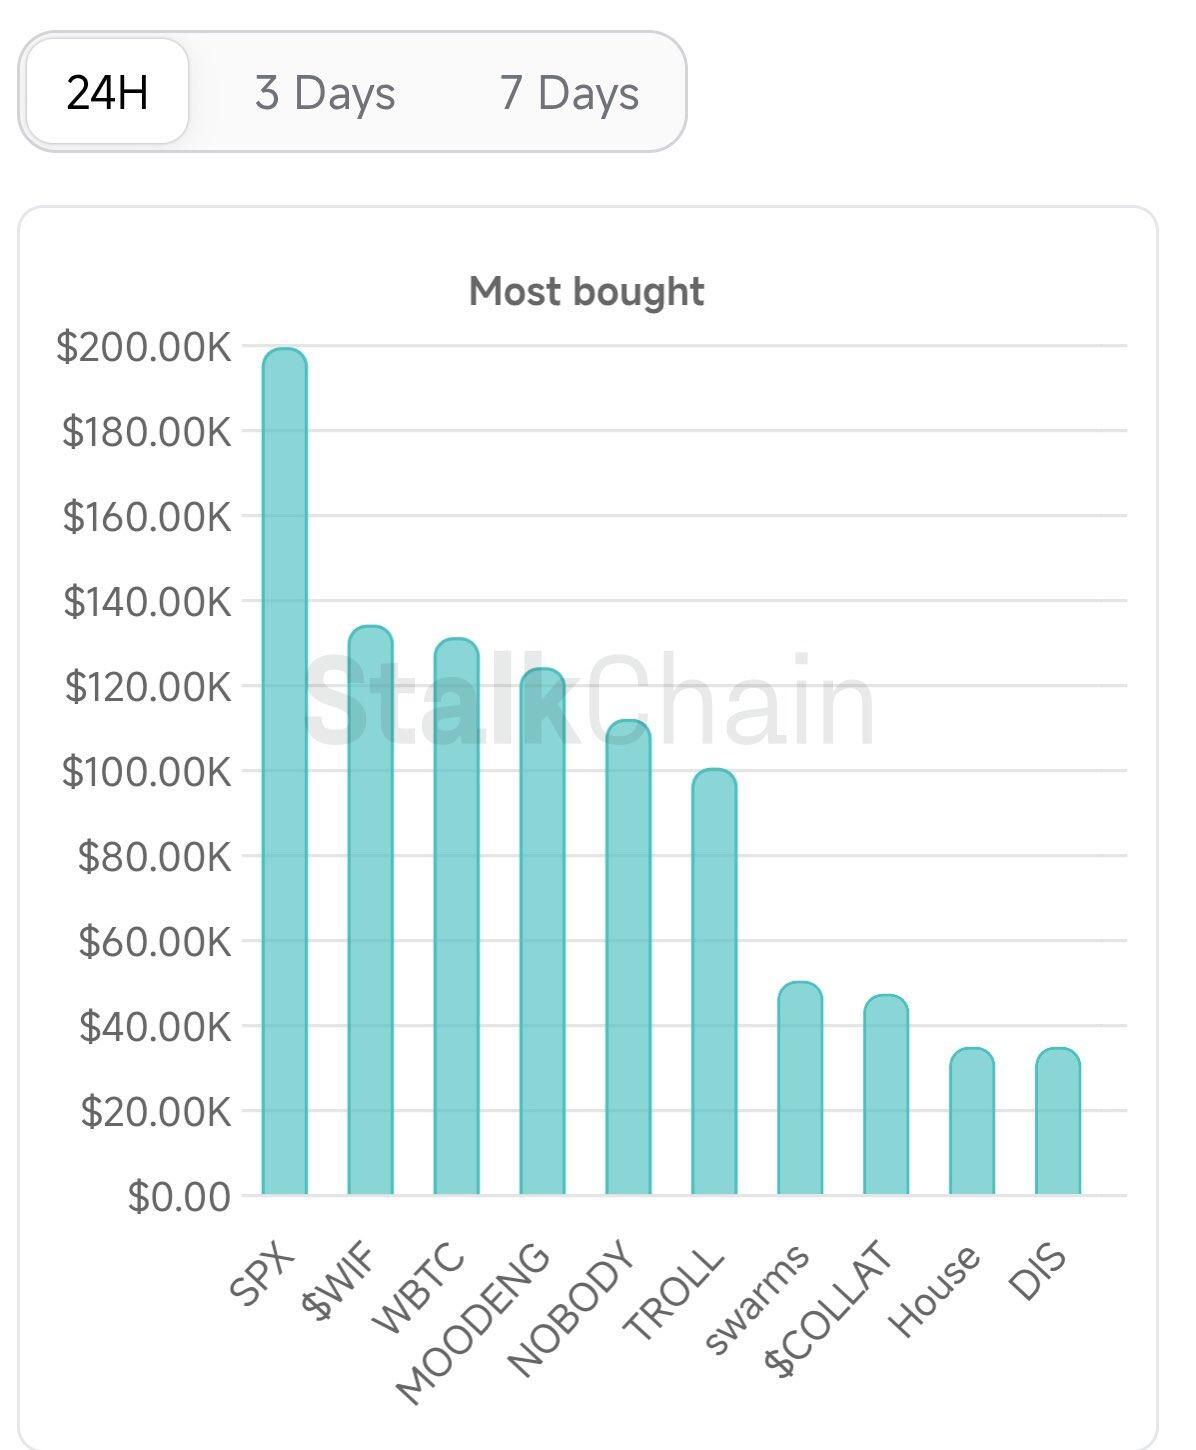
The most bought meme coin (24 hours) chart. Source: StalkChain
According to CoinGecko data, the SPX token has rallied by 33.30% over the last seven days and by more than 10% in the last 24 hours, with a market capitalization of around $917 million. If the positive momentum continues, SPX6900 could overtake FLOKI’s market capitalization in the near term.
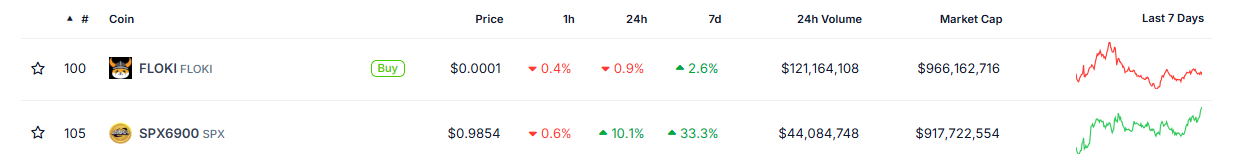
FLOKI and SPX market capitalization chart. Source: CoinGecko
SPX6900 is on the verge of a bullish breakout
SPX6900 price trades inside an ascending channel pattern, drawn by connecting multiple higher highs and higher lows with two upward-sloping trendlines since early March. A breakout above the upper trendline favors the bulls, and At the time of writing on Wednesday, SPX approaches that boundary.
SPX could break above the upper boundary of the ascending channel pattern, which broadly aligns with the 50% price retracement at $1.01 (drawn from the January 19 all-time high of $1.77 to the March low of $0.25). If this occurs, SPX could extend the rally to retest its technical target at $1.47, which is calculated by extrapoling the distance between the two trendlines. However, traders could book some profits around the January 30 high of $1.39.
The Relative Strength Index (RSI) on the daily chart reads 69, pointing upwards toward its overbought level of 70, which suggests strong bullish sentiment. The Moving Average Convergence Divergence (MACD) indicator also showed a bullish crossover last Thursday. It also shows a rising green histogram bar above the neutral value, indicating the continuation of upward momentum.
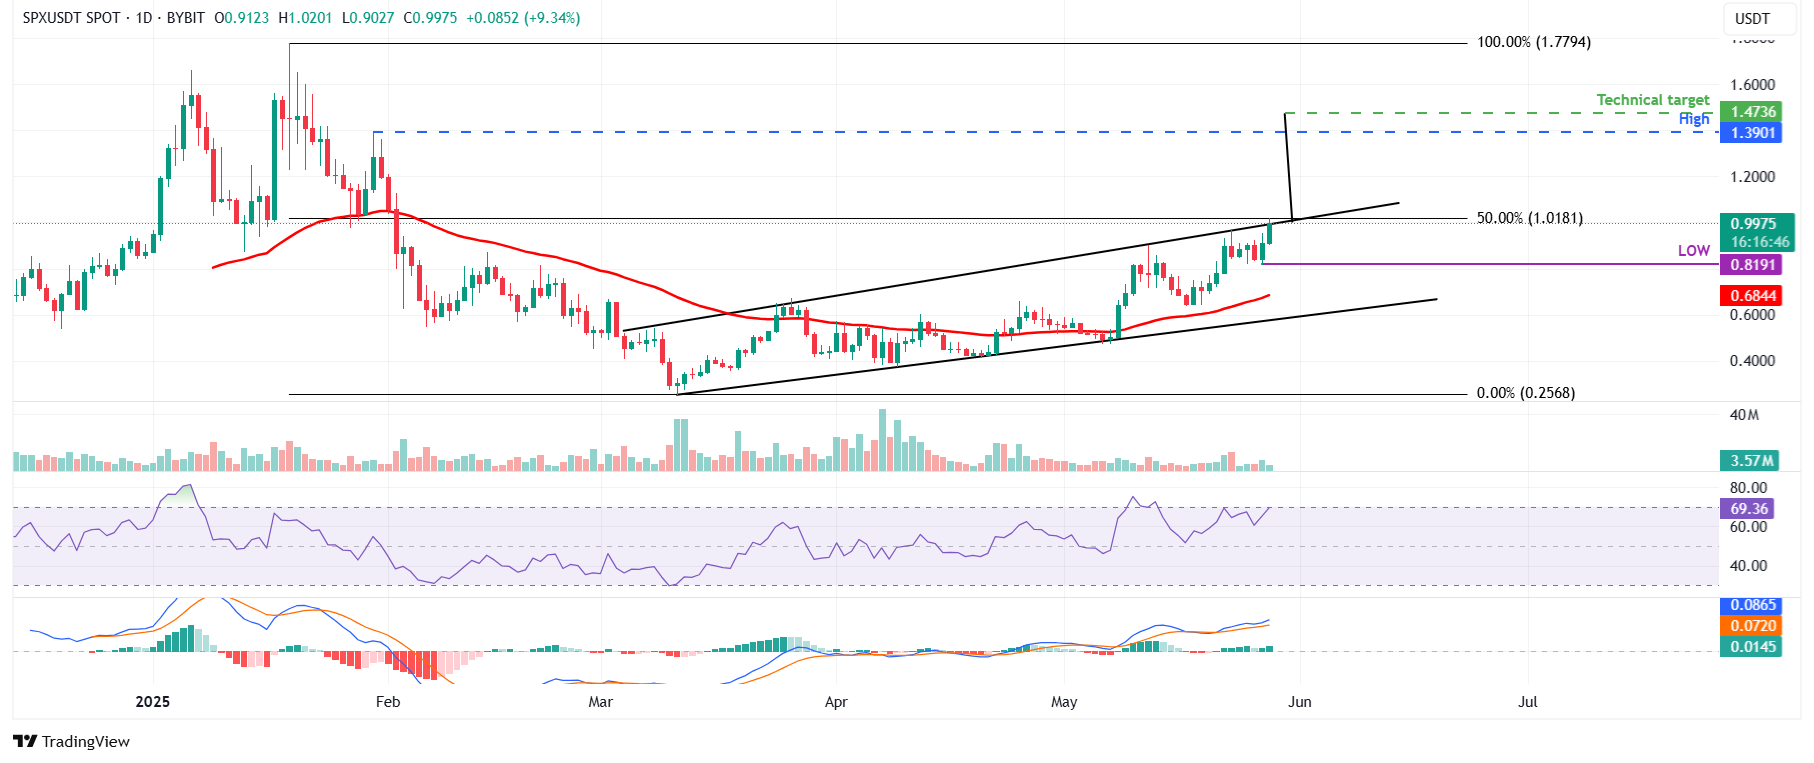
SPX/USDT daily chart
However, if SPX fails to overcome resistance around the upper boundary of the ascending channel pattern, it could extend the correction to retest its Tuesday low of $0.81.
Bài viết đề xuất


