

Bitcoin Price Forecast: BTC rebounds as South Korea martial law proves short-lived
Bitcoin price today: $96,600
- Bitcoin price recovers slightly, trading above $96,000 on Wednesday after its recent dip following news of South Korea’s martial law on Tuesday.
- On-chain data shows that institutional investors bought during the recent price dips.
- Traders should be cautious about recent US government BTC transfers as these could provide a potential sell signal.
Bitcoin (BTC) recovers slightly, trading above $96,000 on Wednesday, after its recent dip on Tuesday due to the political strife in South Korea. With the crisis seeming to be mostly over, BTC recovered more as the reversal of the martial law restored confidence in crypto markets.
While on-chain data shows that institutional investors bought in the recent price dips – a bullish sign for Bitcoin – traders should be cautious about recent US government wallet transfers and rising retail investors’ demand for BTC, which has historically indicated a local top formation.
Bitcoin recovers from recent dips
Bitcoin price corrected slightly below $94K, making a low of $93,578, but quickly recovered as the day ended and closed around $95,800 on Tuesday. This mild dip was triggered by South Korean President Yoon Suk Yeol declaring martial law on Tuesday for the first time in the country since 1980. However, within a few hours, the opposition-led National Assembly passed a resolution to lift it.
CryptoQuant data shows that the Korea Premium Index fell sharply, from -0.29 to -14.67, in just a few hours, indicating Korean investors sell-off. However, it quickly recovered to normal levels as the martial law was lifted.
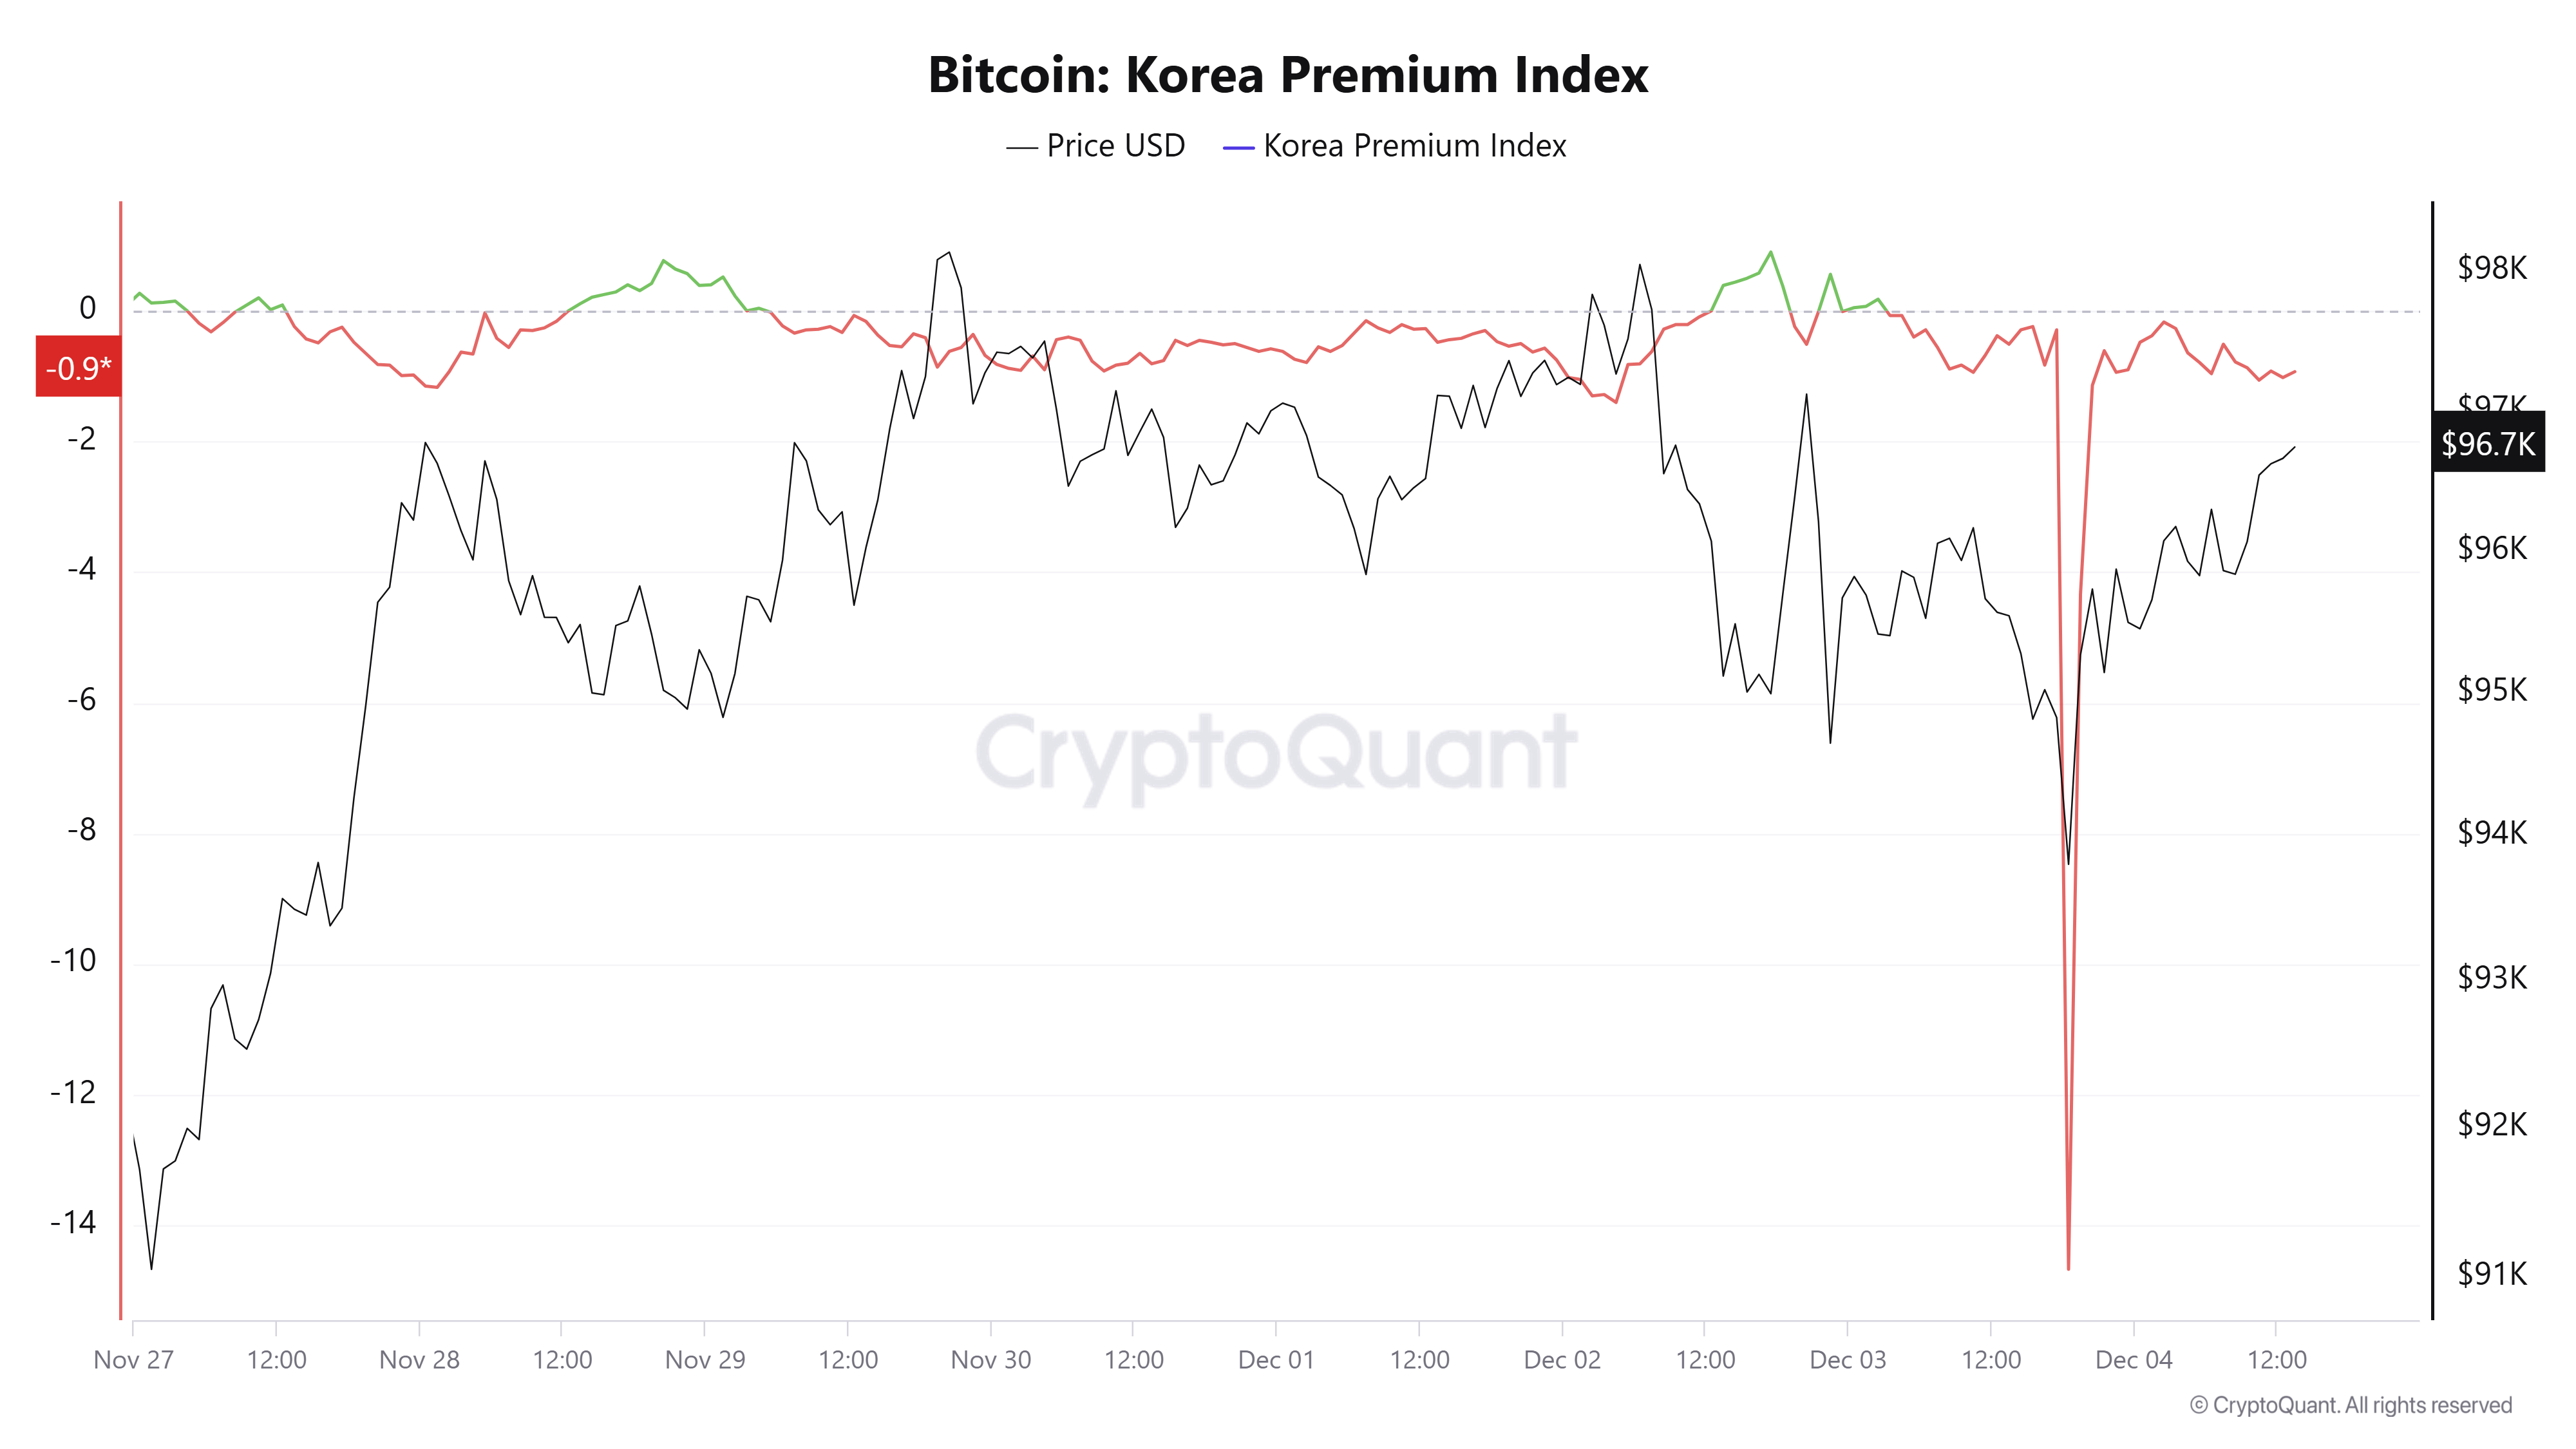
Bitcoin Korean Premium Index chart. Source: CryptoQuant
Institutional investors saw this recent pullback as an accumulation opportunity, as shown in Bitcoin Spot ETF data and the Coinbase exchange outflow graph.
According to Coinglass Exchange Traded Funds (ETF) data, US spot Bitcoin ETFs experienced an inflow of $676 million on Tuesday, its second straight day of inflow this week. Bitcoin’s price could recover further if this inflow trend persists or accelerates.
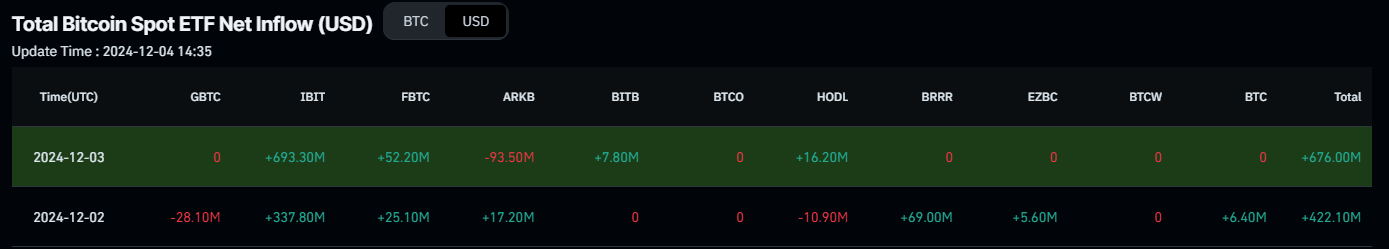
Total Bitcoin Spot ETF Net Inflow chart. Source: Coinglass
Additionally, CryptoQuant data shows that 19,488 BTC was withdrawn from the Coinbase exchange (green spiked bars). This outflow indicates US investors continue to capitalize on even the smallest dips in Bitcoin’s price.
 - Coinbase Advanced-638689094198700573.png)
Bitcoin Exchange outflow Coinbase chart. Source: CryptoQuant
Despite these accumulations of dips, traders should be cautious as the US government wallet moved many altcoins like Ethereum, Compound, Axie Infinity, and others worth $33.59 million into new wallets on Tuesday after it moved 10K BTC worth $962.88 million the previous day. If they intend to sell or distribute these coins, they can create bearish sentiment as market participants anticipate increased supply.
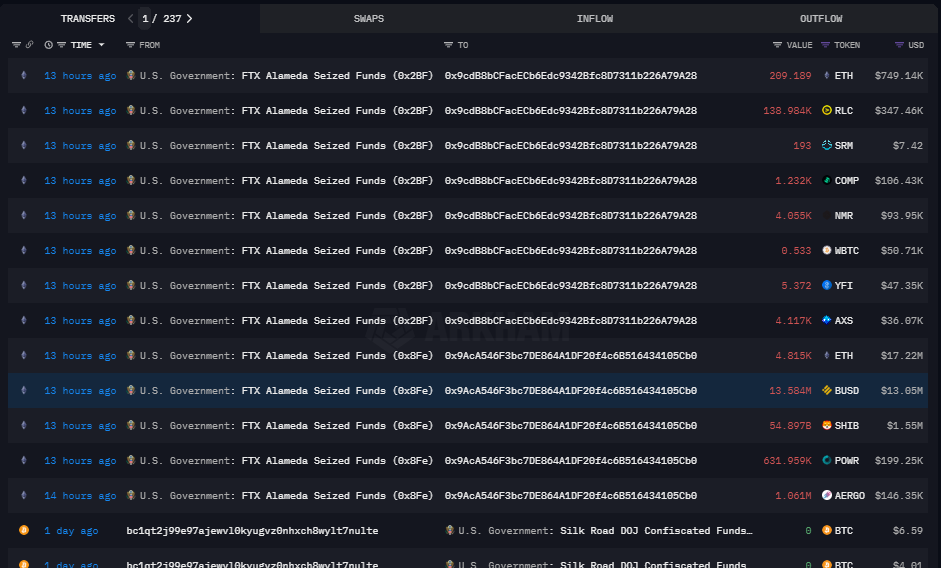
US government transfer. Source: Arkham
Lastly, CryptoQuant’s 30-day demand change from retail investors has reached its highest level since 2020, as retail investors appear increasingly interested in Bitcoin. Historically, increased retail participation has often signaled a potential local top, like on May 19, 2020, when demand reached the highest BTC price, corrected from $9,679 to $8,832 in a week.
However, it also highlights growing market engagement, which can create sustained positive momentum when combined with institutional interest.
 Demand 30D Change-638689095777719489.png)
Bitcoin Retail Investor chart. Source: CryptoQuant
Bitcoin Price Forecast: BTC recovers trading above $96,00.
Bitcoin price began the week with a 1.38% decline, hitting a low of $93,578 on Tuesday, but it recovered and closed above $95,800. At the time of writing on Wednesday, it continues to recover and trades above $96,600.
If BTC continues its recovery, it could rally to reach its all-time high (ATH) level of $99,588.
However, traders should be cautious as momentum indicators show weakening price action. The Relative Strength Index (RSI) on the daily chart reads 64, rejected for its overbought level of 70 and points downwards, indicating weak bullish momentum. Moreover, the Moving Average Convergence Divergence (MACD) indicator also showed a bearish crossover on November 25, generating sell signals. The MACD also shows rising red histogram bars below the neutral line zero, suggesting that Bitcoin’s price could experience downward momentum.
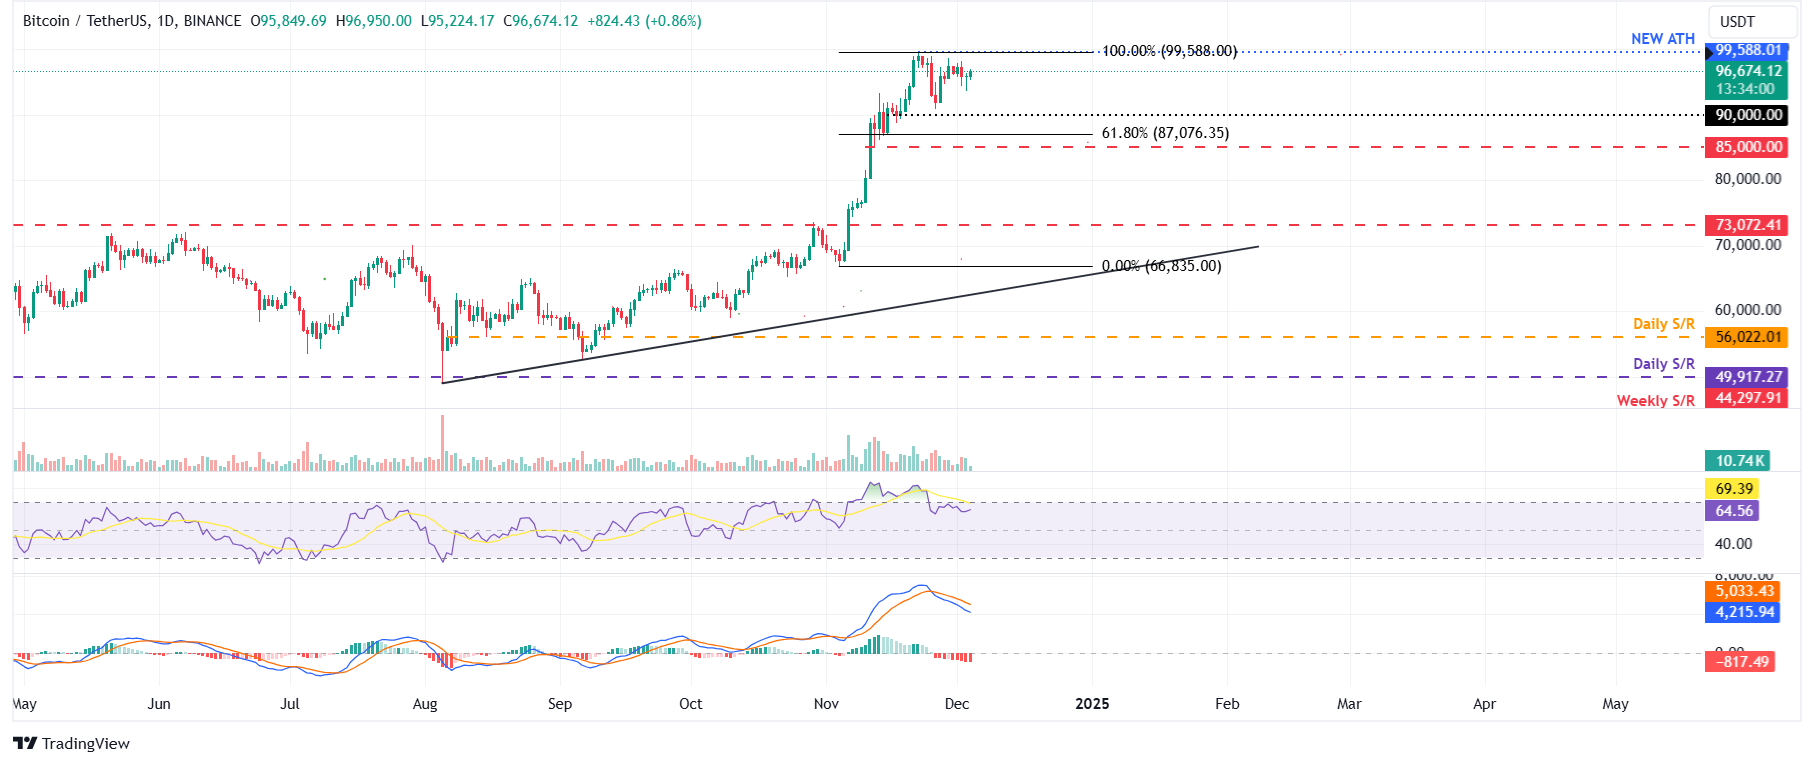
BTC/USDT daily chart
If BTC continues its decline, it could extend the correction to retest its $90,000 support level.
Bitcoin, altcoins, stablecoins FAQs
Bitcoin is the largest cryptocurrency by market capitalization, a virtual currency designed to serve as money. This form of payment cannot be controlled by any one person, group, or entity, which eliminates the need for third-party participation during financial transactions.
Altcoins are any cryptocurrency apart from Bitcoin, but some also regard Ethereum as a non-altcoin because it is from these two cryptocurrencies that forking happens. If this is true, then Litecoin is the first altcoin, forked from the Bitcoin protocol and, therefore, an “improved” version of it.
Stablecoins are cryptocurrencies designed to have a stable price, with their value backed by a reserve of the asset it represents. To achieve this, the value of any one stablecoin is pegged to a commodity or financial instrument, such as the US Dollar (USD), with its supply regulated by an algorithm or demand. The main goal of stablecoins is to provide an on/off-ramp for investors willing to trade and invest in cryptocurrencies. Stablecoins also allow investors to store value since cryptocurrencies, in general, are subject to volatility.
Bitcoin dominance is the ratio of Bitcoin's market capitalization to the total market capitalization of all cryptocurrencies combined. It provides a clear picture of Bitcoin’s interest among investors. A high BTC dominance typically happens before and during a bull run, in which investors resort to investing in relatively stable and high market capitalization cryptocurrency like Bitcoin. A drop in BTC dominance usually means that investors are moving their capital and/or profits to altcoins in a quest for higher returns, which usually triggers an explosion of altcoin rallies.
Bài viết đề xuất


