
Bitcoin Price Forecast: BTC holds above $114,000 amid a fresh wave of institutional accumulation
- Bitcoin price finds support around the 50-day EMA after being rejected at a key resistance level.
- US-listed spot ETF recorded $149.30 million in inflows on Monday, extending a three-day streak of positive flow.
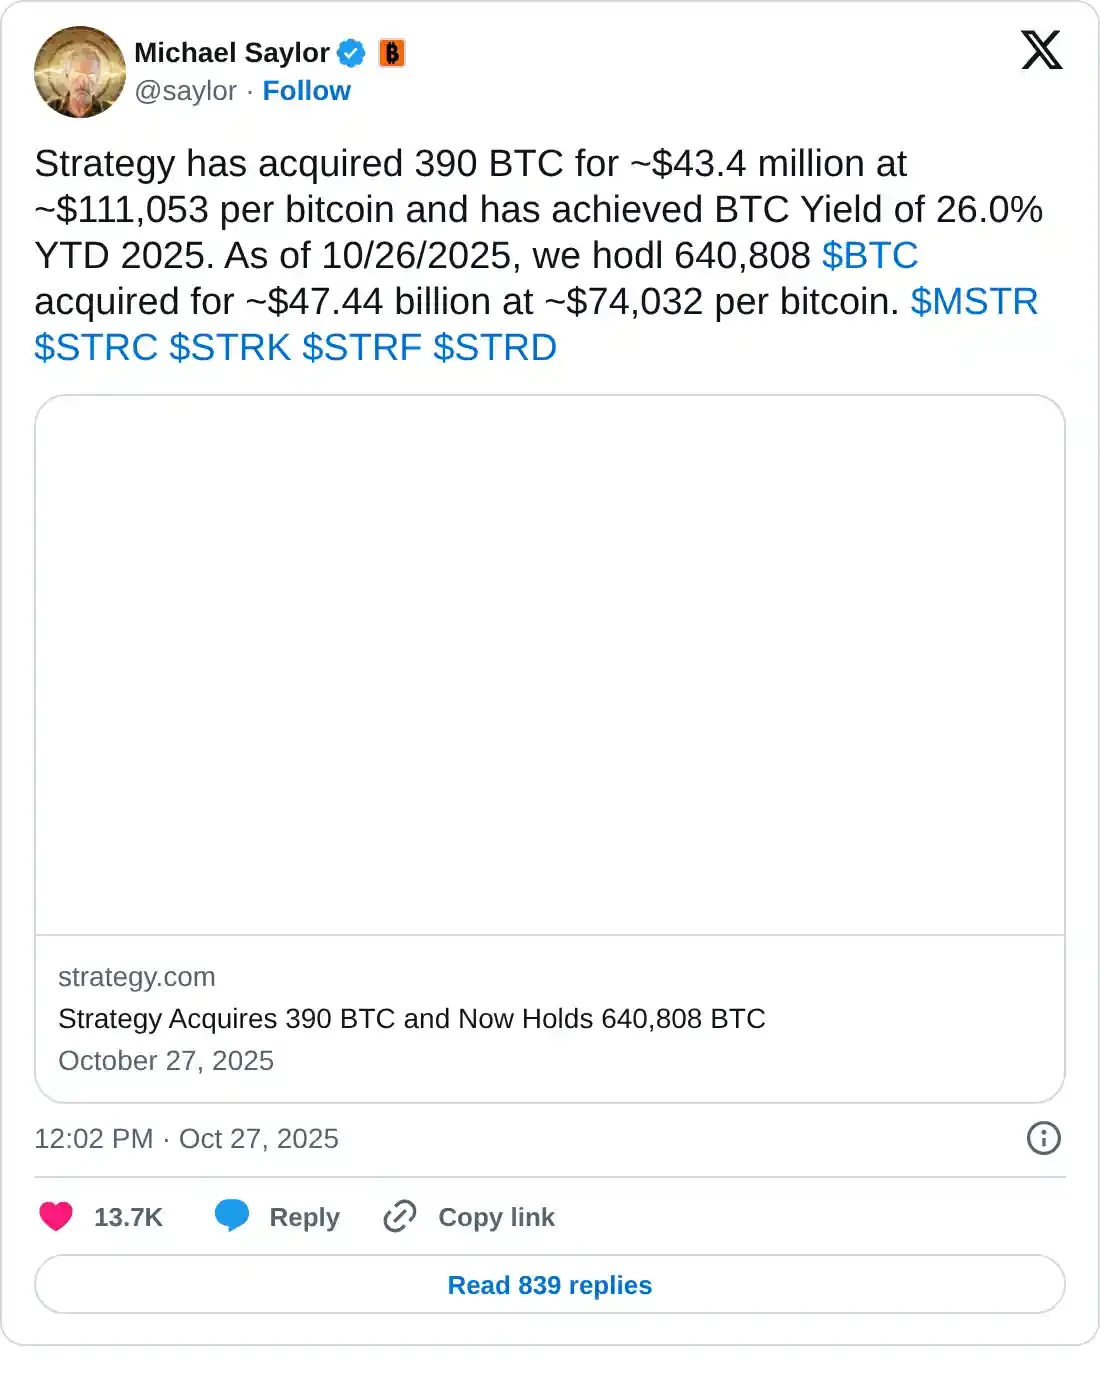
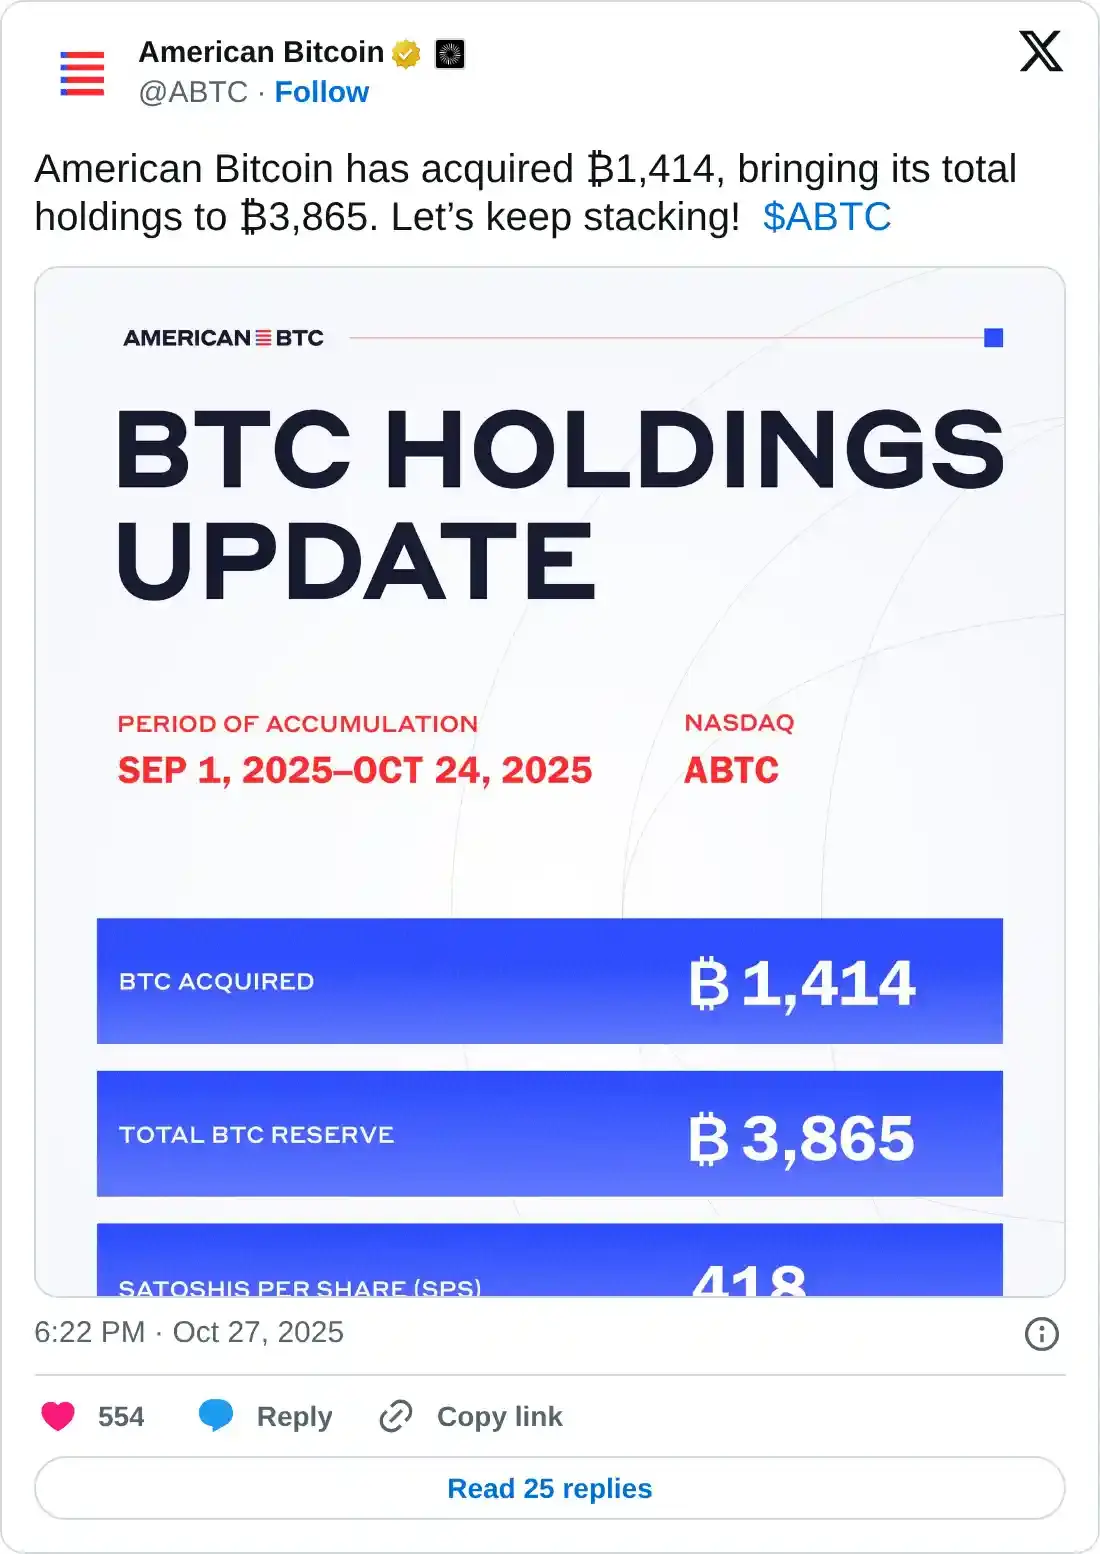
- Institutional demand continues to strengthen, with Strategy adding 390 BTC and American Bitcoin acquiring 1,414 BTC.
Bitcoin (BTC) is trading above $114,000 at the time of writing on Tuesday, after finding support around the key level. A steady stream of capital from spot Bitcoin ETFs and fresh accumulation by institutions like Strategy and American Bitcoin highlight growing confidence, setting the stage for a potential continuation of the bullish trend.
Strategy and Trump-linked American Bitcoin adds more BTC to reserve
Institutional demand strengthens as the week begins, as on Monday, Strategy announced that the firm has added 390 BTC and currently holds a total of 640,808 BTC in reserves worth $47.44 billion.
During the same period, US President Donald Trump's sons Eric and Donald Trump Jr.'s company American Bitcoin announced the acquisition of 1,414 BTC worth approximately $163 million, bringing its total holdings to 3,865 BTC.
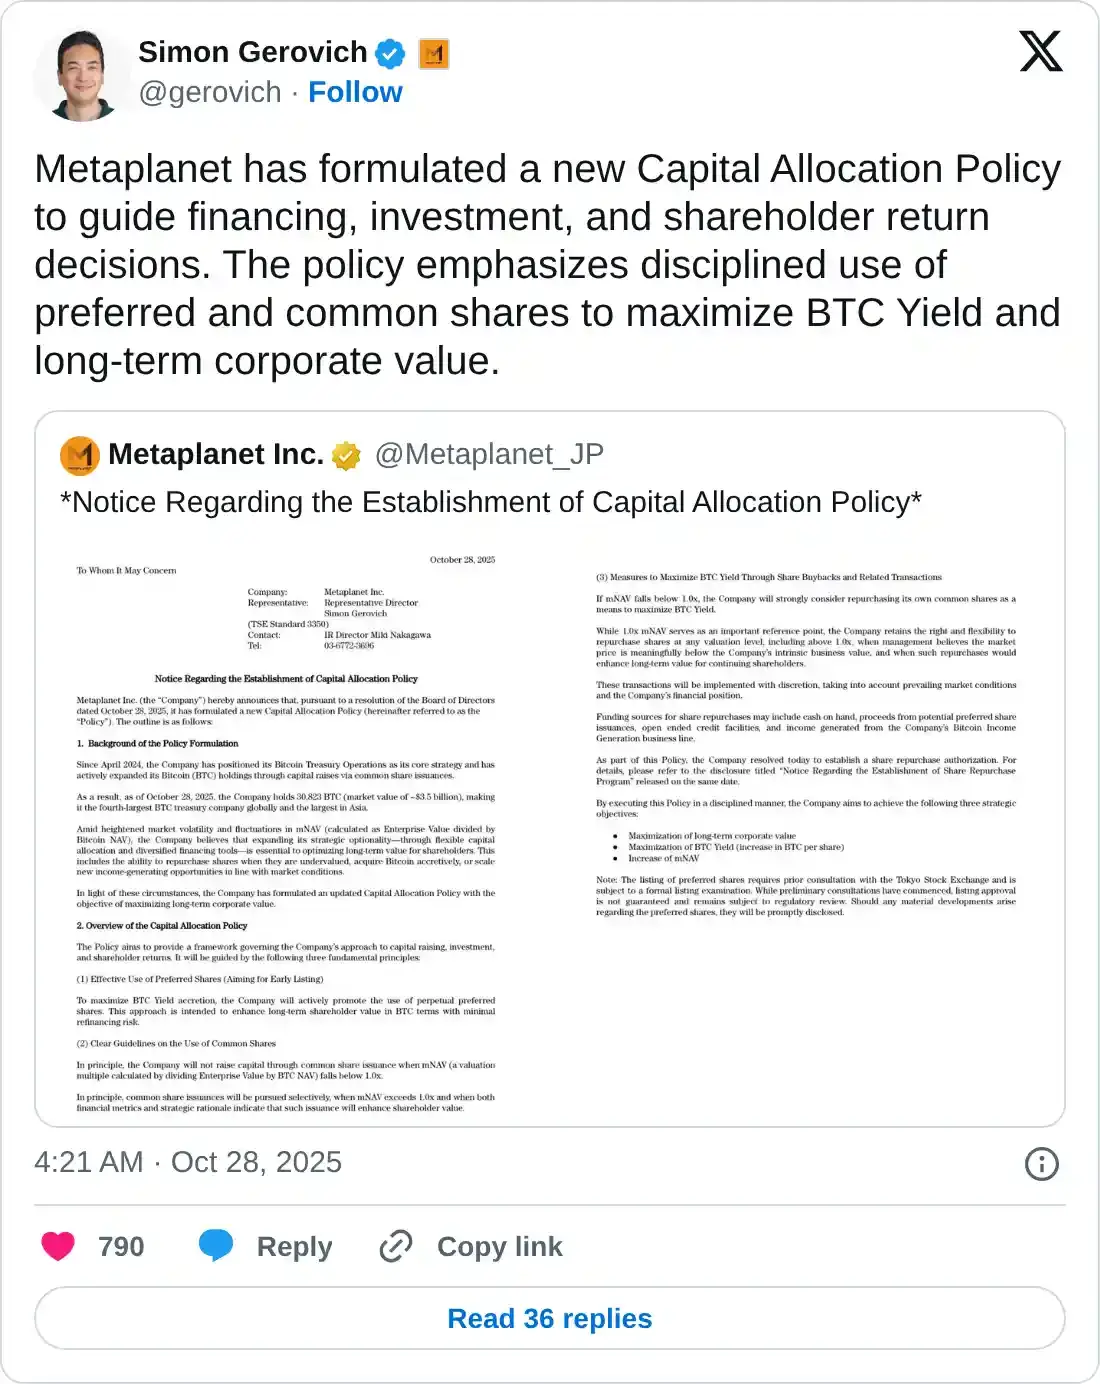
Bitcoin treasury company MetaPlanet announced on Tuesday a share repurchase program to repurchase 150 million common shares, valued at $495 million.
Simon Gerovich, President of MetaPlanet, said on his X post, “Metaplanet has formulated a new Capital Allocation Policy to guide financing, investment, and shareholder return decisions. The policy emphasizes disciplined use of preferred and common shares to maximize BTC Yield and long-term corporate value.”
Bitcoin spot ETFs record positive inflows
US-listed spot ETF flows continue to strengthen so far this week. According to SoSoValue data, spot Bitcoin ETFs recorded inflows of $149.30 million on Monday, extending a three-day streak of positive inflows since last Thursday. If these inflows continue and intensify, BTC could further extend its ongoing recovery.
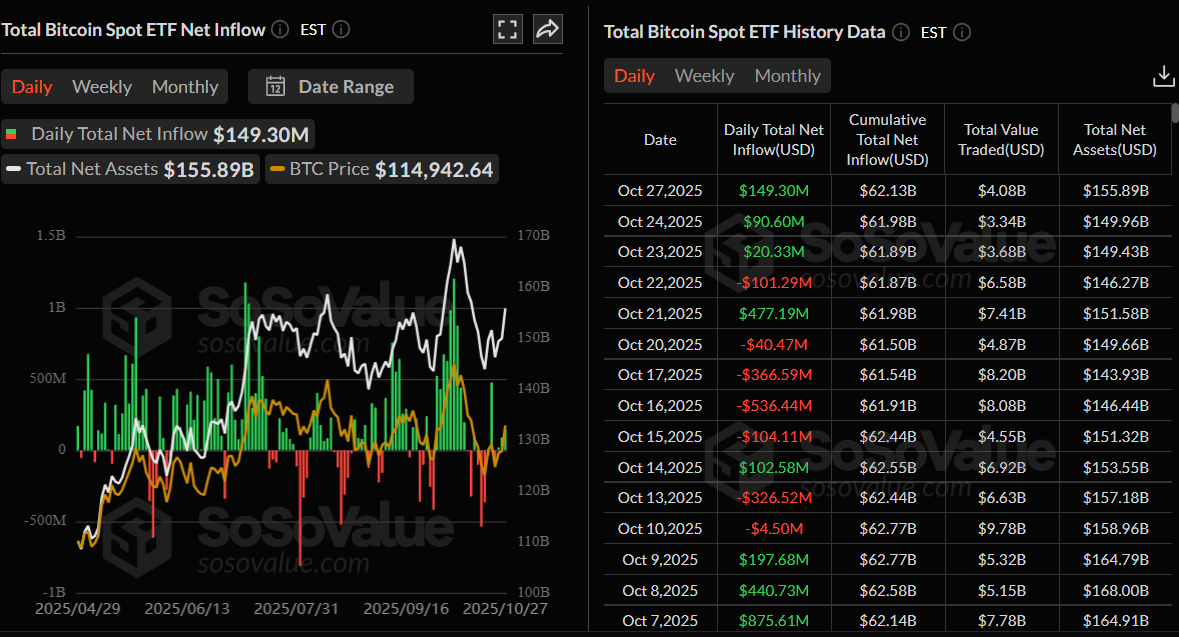
Total Bitcoin Spot ETF net inflow chart. Source: SoSoValue
Bitcoin crash tied to Trump tariff fears, recovery underway
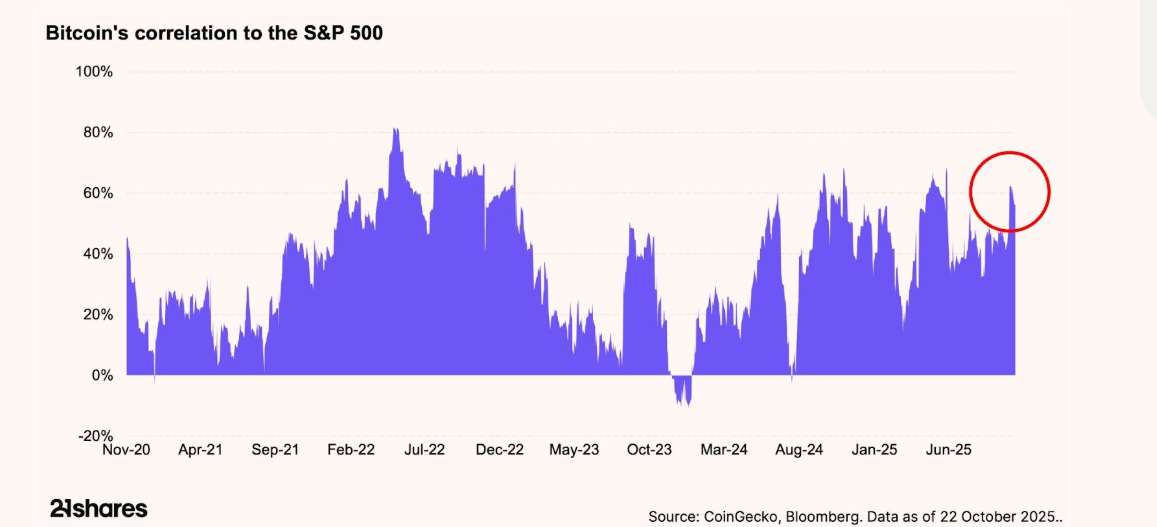
The 21Shares weekly report noted that the October 10 market crash was sparked by President Trump’s proposed 100% tariffs on Chinese imports, which reignited trade-war fears and pushed Bitcoin’s correlation with the S&P 500 above 60%.
However, analysts noted that the rhetoric appears to be more of a negotiation tactic than a firm policy, with Trump signaling potential de-escalation. As a result, digital assets have started to rebound, with this week’s mini-rally suggesting the possibility of a broader market recovery if trade tensions continue to ease, similar to the post-Liberation Day rally, when the total crypto market cap surged over 50% in just six weeks.
Bitcoin Price Forecast: BTC finds support around the 50-day EMA
Bitcoin price found support around the 61.8% Fibonacci retracement level (drawn from the April low of $74,508 to the record high of $126,199) at $106,453 on Wednesday. BTC rose 6.57% in the next four days and closed above the 50-day Exponential Moving Average (EMA) at $113,407. However, BTC faced slight rejection from the 78.6% Fibonacci retracement level at $115,137. At the time of writing on Tuesday, BTC finds support around the 50-day EMA at $113,407.
If BTC closes above the 78.6% Fibonacci retracement at $115,137, it could extend the rally toward the psychologically important $120,000 level.
The Relative Strength Index (RSI) on the daily chart reads 53, above the neutral level of 50, indicating bullish momentum gaining traction. Additionally, the Moving Average Convergence Divergence (MACD) showed a bullish crossover on Sunday, providing a buy signal and further supporting the bullish view.
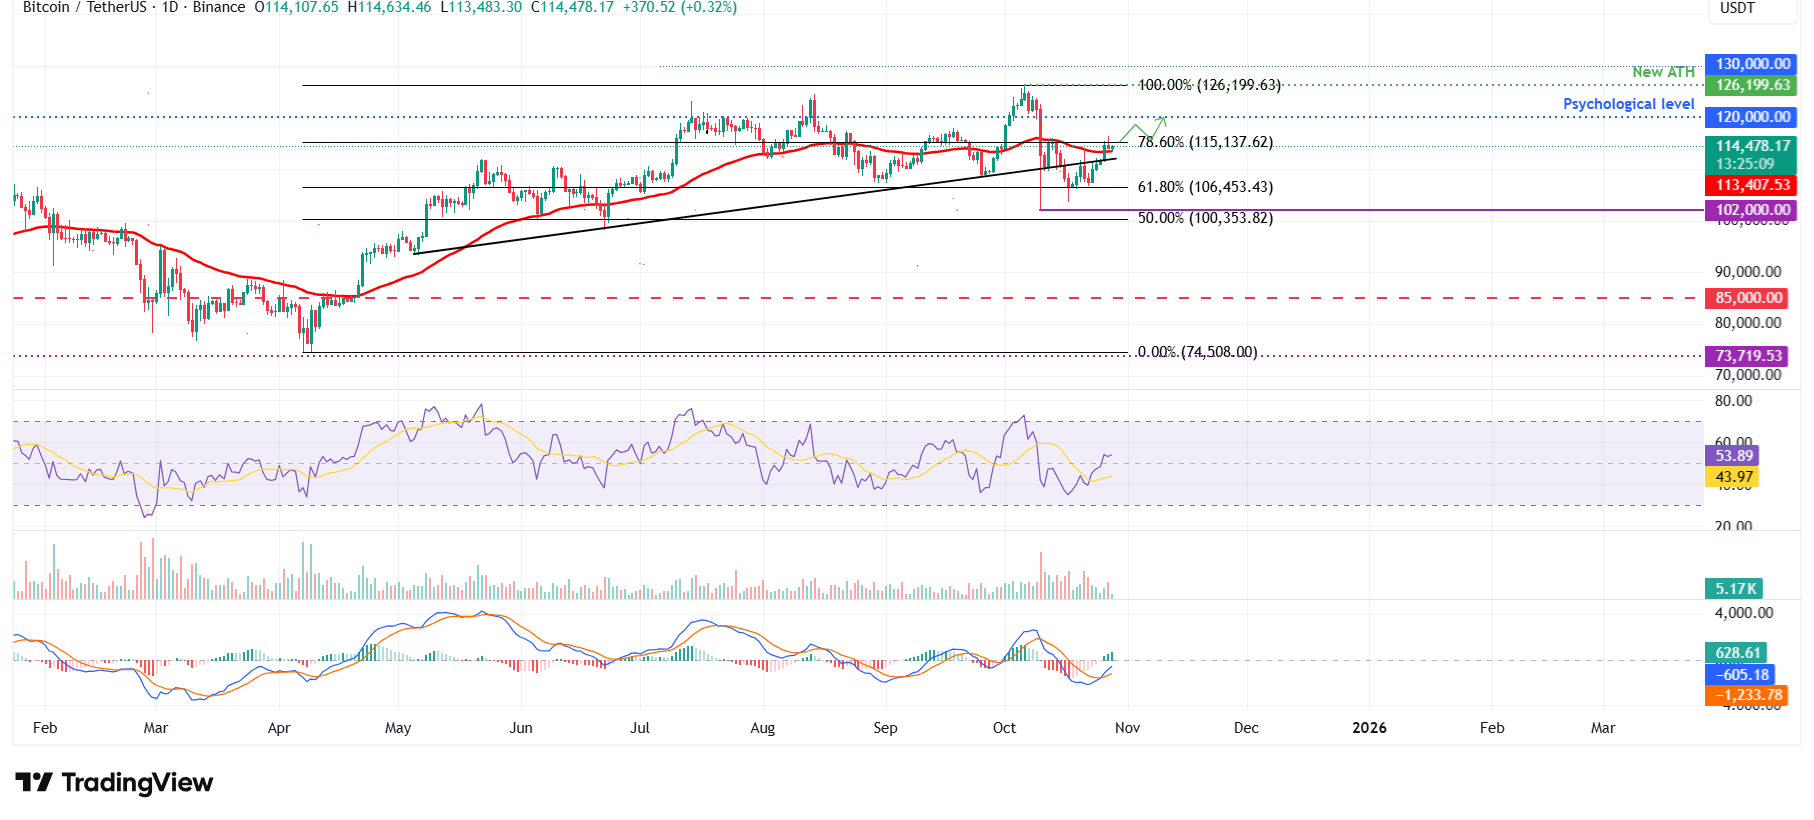
BTC/USDT daily chart
On the other hand, if BTC faces rejection and closes below the 50-day EMA at $113,407, it could extend the decline toward the next support at $110,000.
Bitcoin, altcoins, stablecoins FAQs
Bitcoin is the largest cryptocurrency by market capitalization, a virtual currency designed to serve as money. This form of payment cannot be controlled by any one person, group, or entity, which eliminates the need for third-party participation during financial transactions.
Altcoins are any cryptocurrency apart from Bitcoin, but some also regard Ethereum as a non-altcoin because it is from these two cryptocurrencies that forking happens. If this is true, then Litecoin is the first altcoin, forked from the Bitcoin protocol and, therefore, an “improved” version of it.
Stablecoins are cryptocurrencies designed to have a stable price, with their value backed by a reserve of the asset it represents. To achieve this, the value of any one stablecoin is pegged to a commodity or financial instrument, such as the US Dollar (USD), with its supply regulated by an algorithm or demand. The main goal of stablecoins is to provide an on/off-ramp for investors willing to trade and invest in cryptocurrencies. Stablecoins also allow investors to store value since cryptocurrencies, in general, are subject to volatility.
Bitcoin dominance is the ratio of Bitcoin's market capitalization to the total market capitalization of all cryptocurrencies combined. It provides a clear picture of Bitcoin’s interest among investors. A high BTC dominance typically happens before and during a bull run, in which investors resort to investing in relatively stable and high market capitalization cryptocurrency like Bitcoin. A drop in BTC dominance usually means that investors are moving their capital and/or profits to altcoins in a quest for higher returns, which usually triggers an explosion of altcoin rallies.
Bài viết đề xuất


