
Crypto Gainers: Fartcoin, Chainlink, Solana surge as Scott Bessent urges 50bps rate cut
- Fartcoin has appreciated by over 20% in the last 24 hours, leading the market recovery.
- Chainlink jumped 12% on Tuesday, reaching levels last seen on February 1.
- Solana edges higher to extend the 9% gains from Tuesday, approaching the $200 psychological level.
Altcoins such as Fartcoin (FARTCOIN), Chainlink (LINK), and Solana (SOL) rank as top performers over the last 24 hours as the market trades in the green with the US Consumer Price Index (CPI) of July remaining at 2.7% and the US Treasury Secretary Scott Bessent floating ideas of a 50 basis point rate cut.
Fartcoin leads the bullish way
Fartcoin edges higher by 1% at press time on Tuesday, extending the 19% jump from the previous day. The Solana-based meme coin reclaims the $1.000 psychological level and the 61.8% Fibonacci level at $1.005, which is drawn from the $2.740 high on January 19 to the $0.198 low on March 10.
To reinforce an uptrend, FARTCOIN should surpass the $1.085 level to outgrow the bearish engulfing candle formed on Monday. This could extend the rally to the 78.6% Fibonacci level at $1.562.
The Moving Average Convergence Divergence (MACD) line, merged with its signal line, is flashing mixed signals. Still, the Relative Strength Index (RSI) at 48 bounces off to neutral levels, indicating recovery in buying pressure.
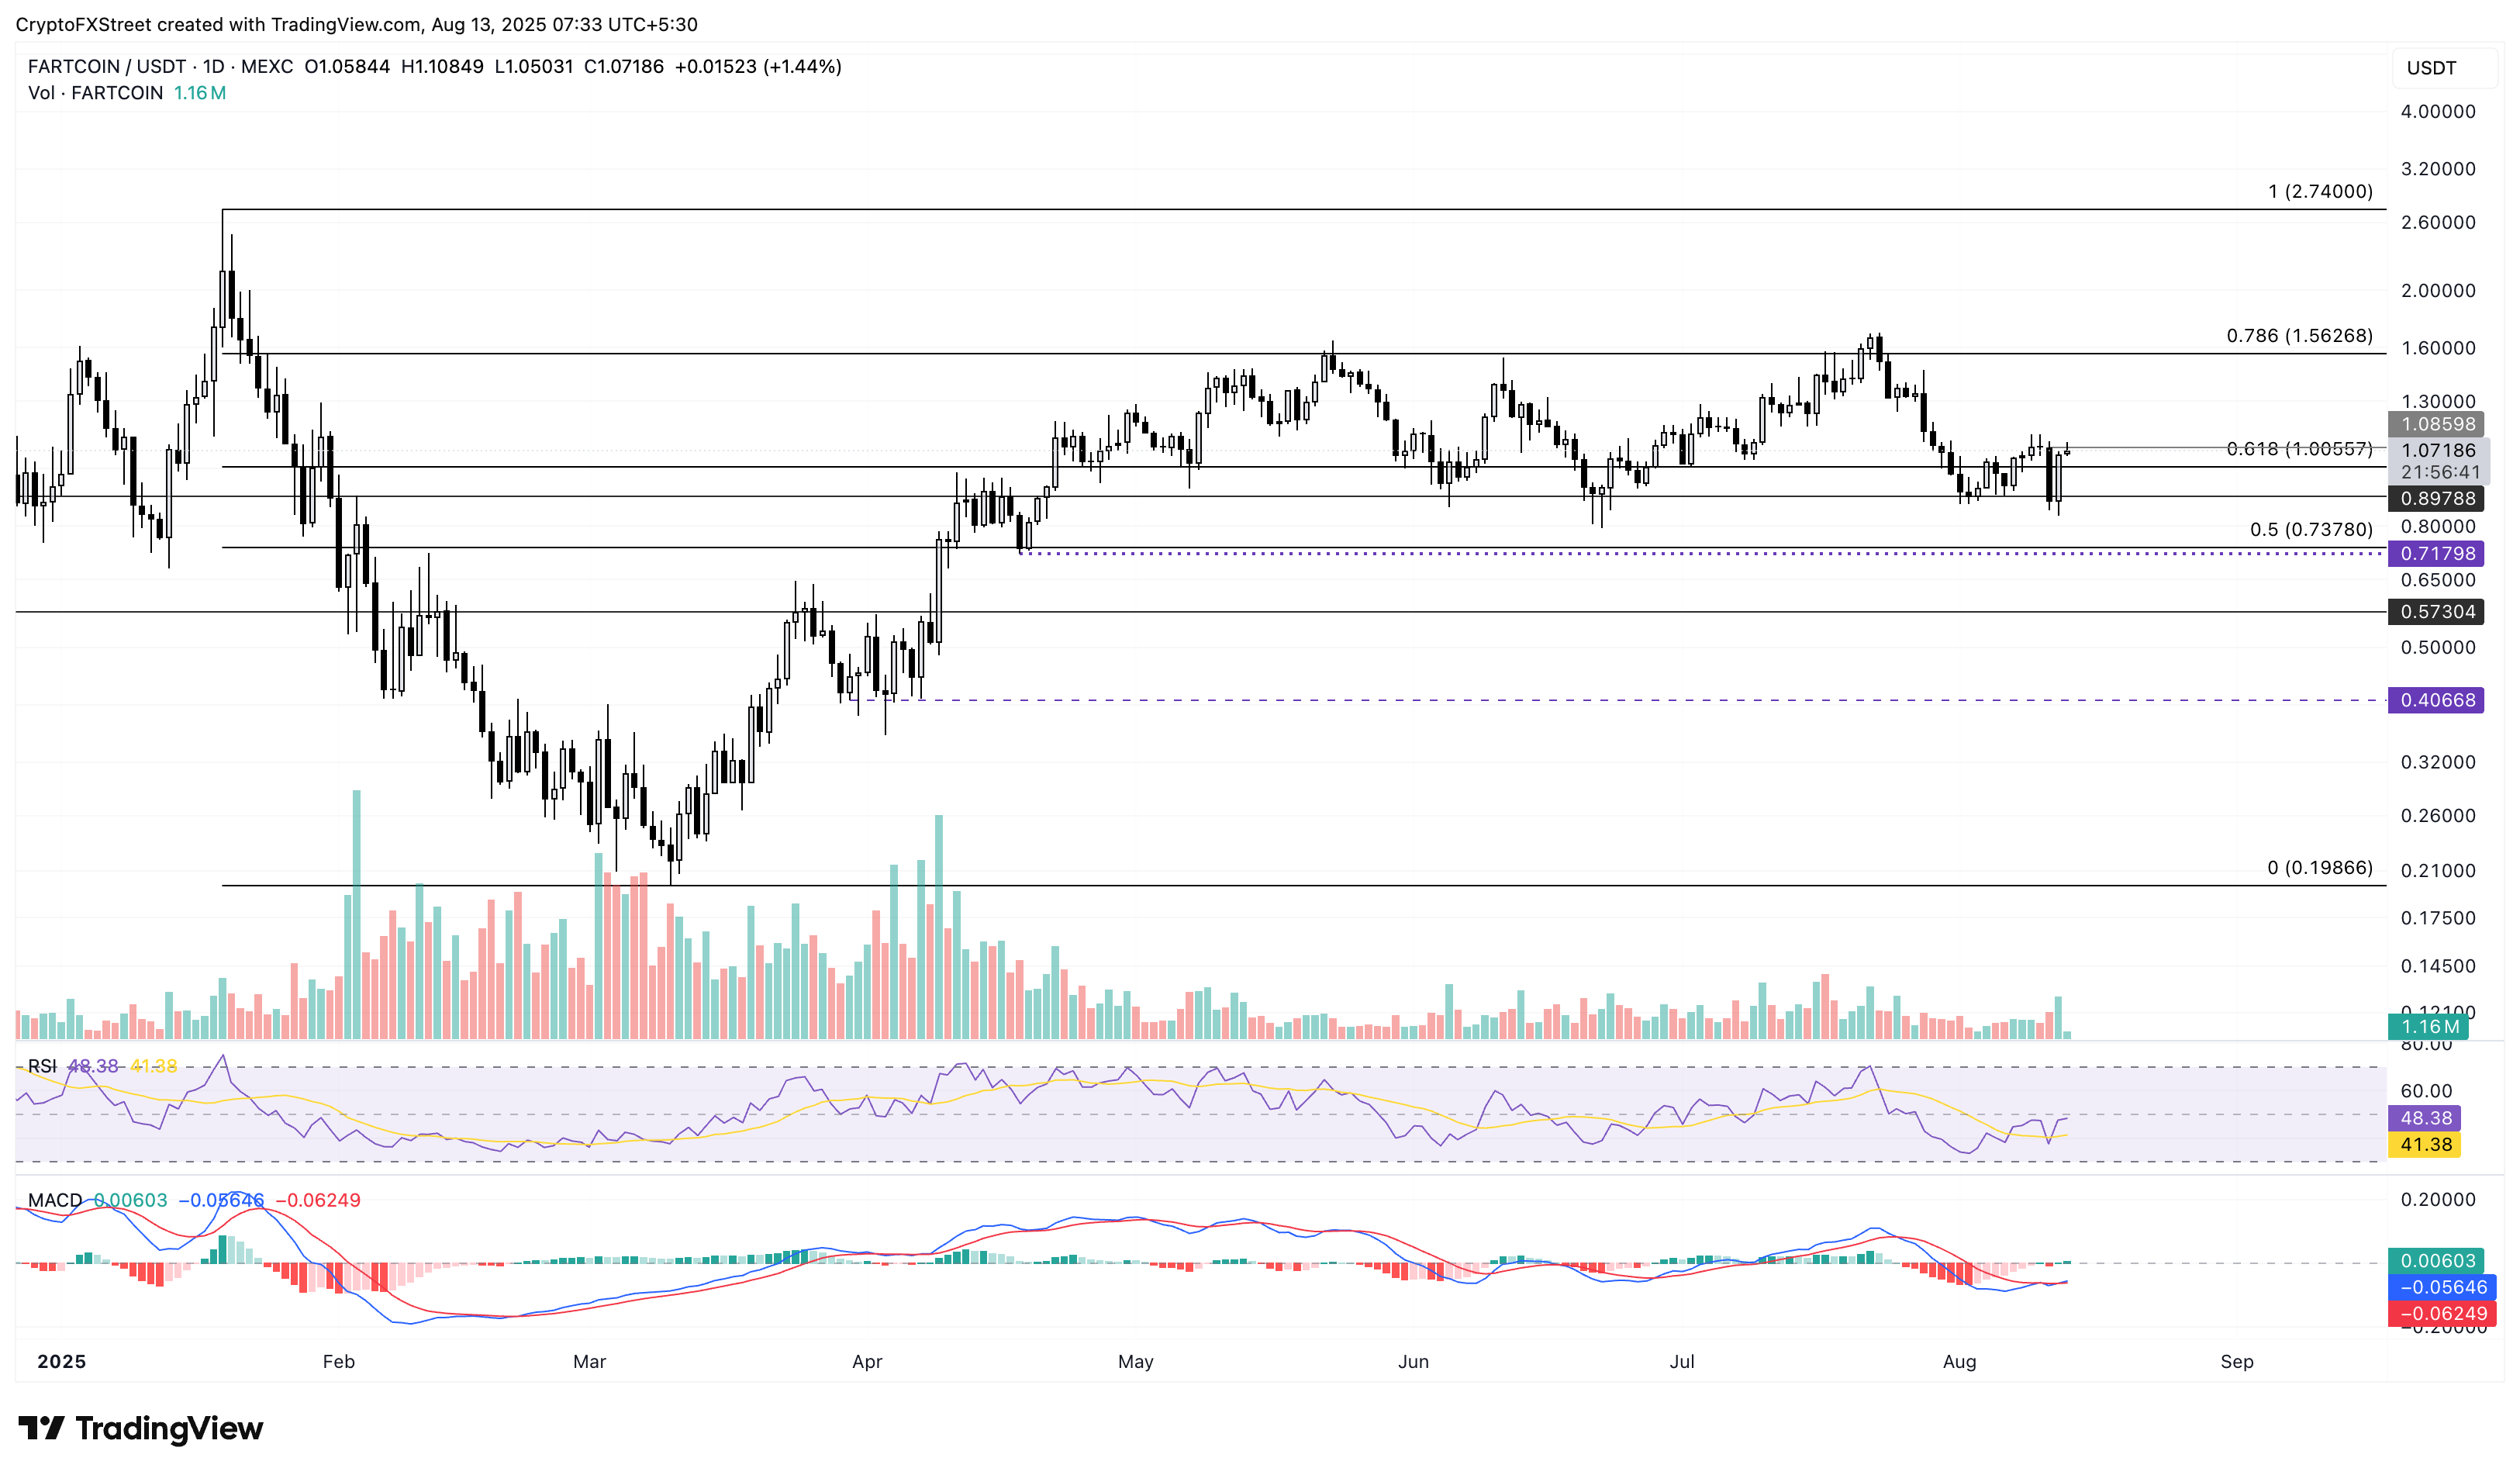
FARTCOIN/USDT daily price chart.
Looking down, the meme coin risks a steeper correction to $0.737, aligning with the 50% retracement level if it drops below $1.000.
Chainlink reignites the bullish trend
Chainlink regains bullish momentum with the launch of high-quality forex and precious metals data on-chain, as previously reported by FXStreet. LINK edges higher by 2% at press time on Wednesday, adding to the 12% gains from Tuesday and restarting the bullish run after a 4.49% hiccup on Monday.
The uptrend in LINK targets the $26.86 level last tested on January 22, for a 10% upmove from the current market price.
Investors should consider tempering their expectations, as the RSI at 73 signals overbought conditions due to heightened buying pressure, which carries the risk of oversaturation.
Still, the bullish momentum on the rise keeps the MACD and its signal line on an uptrend.
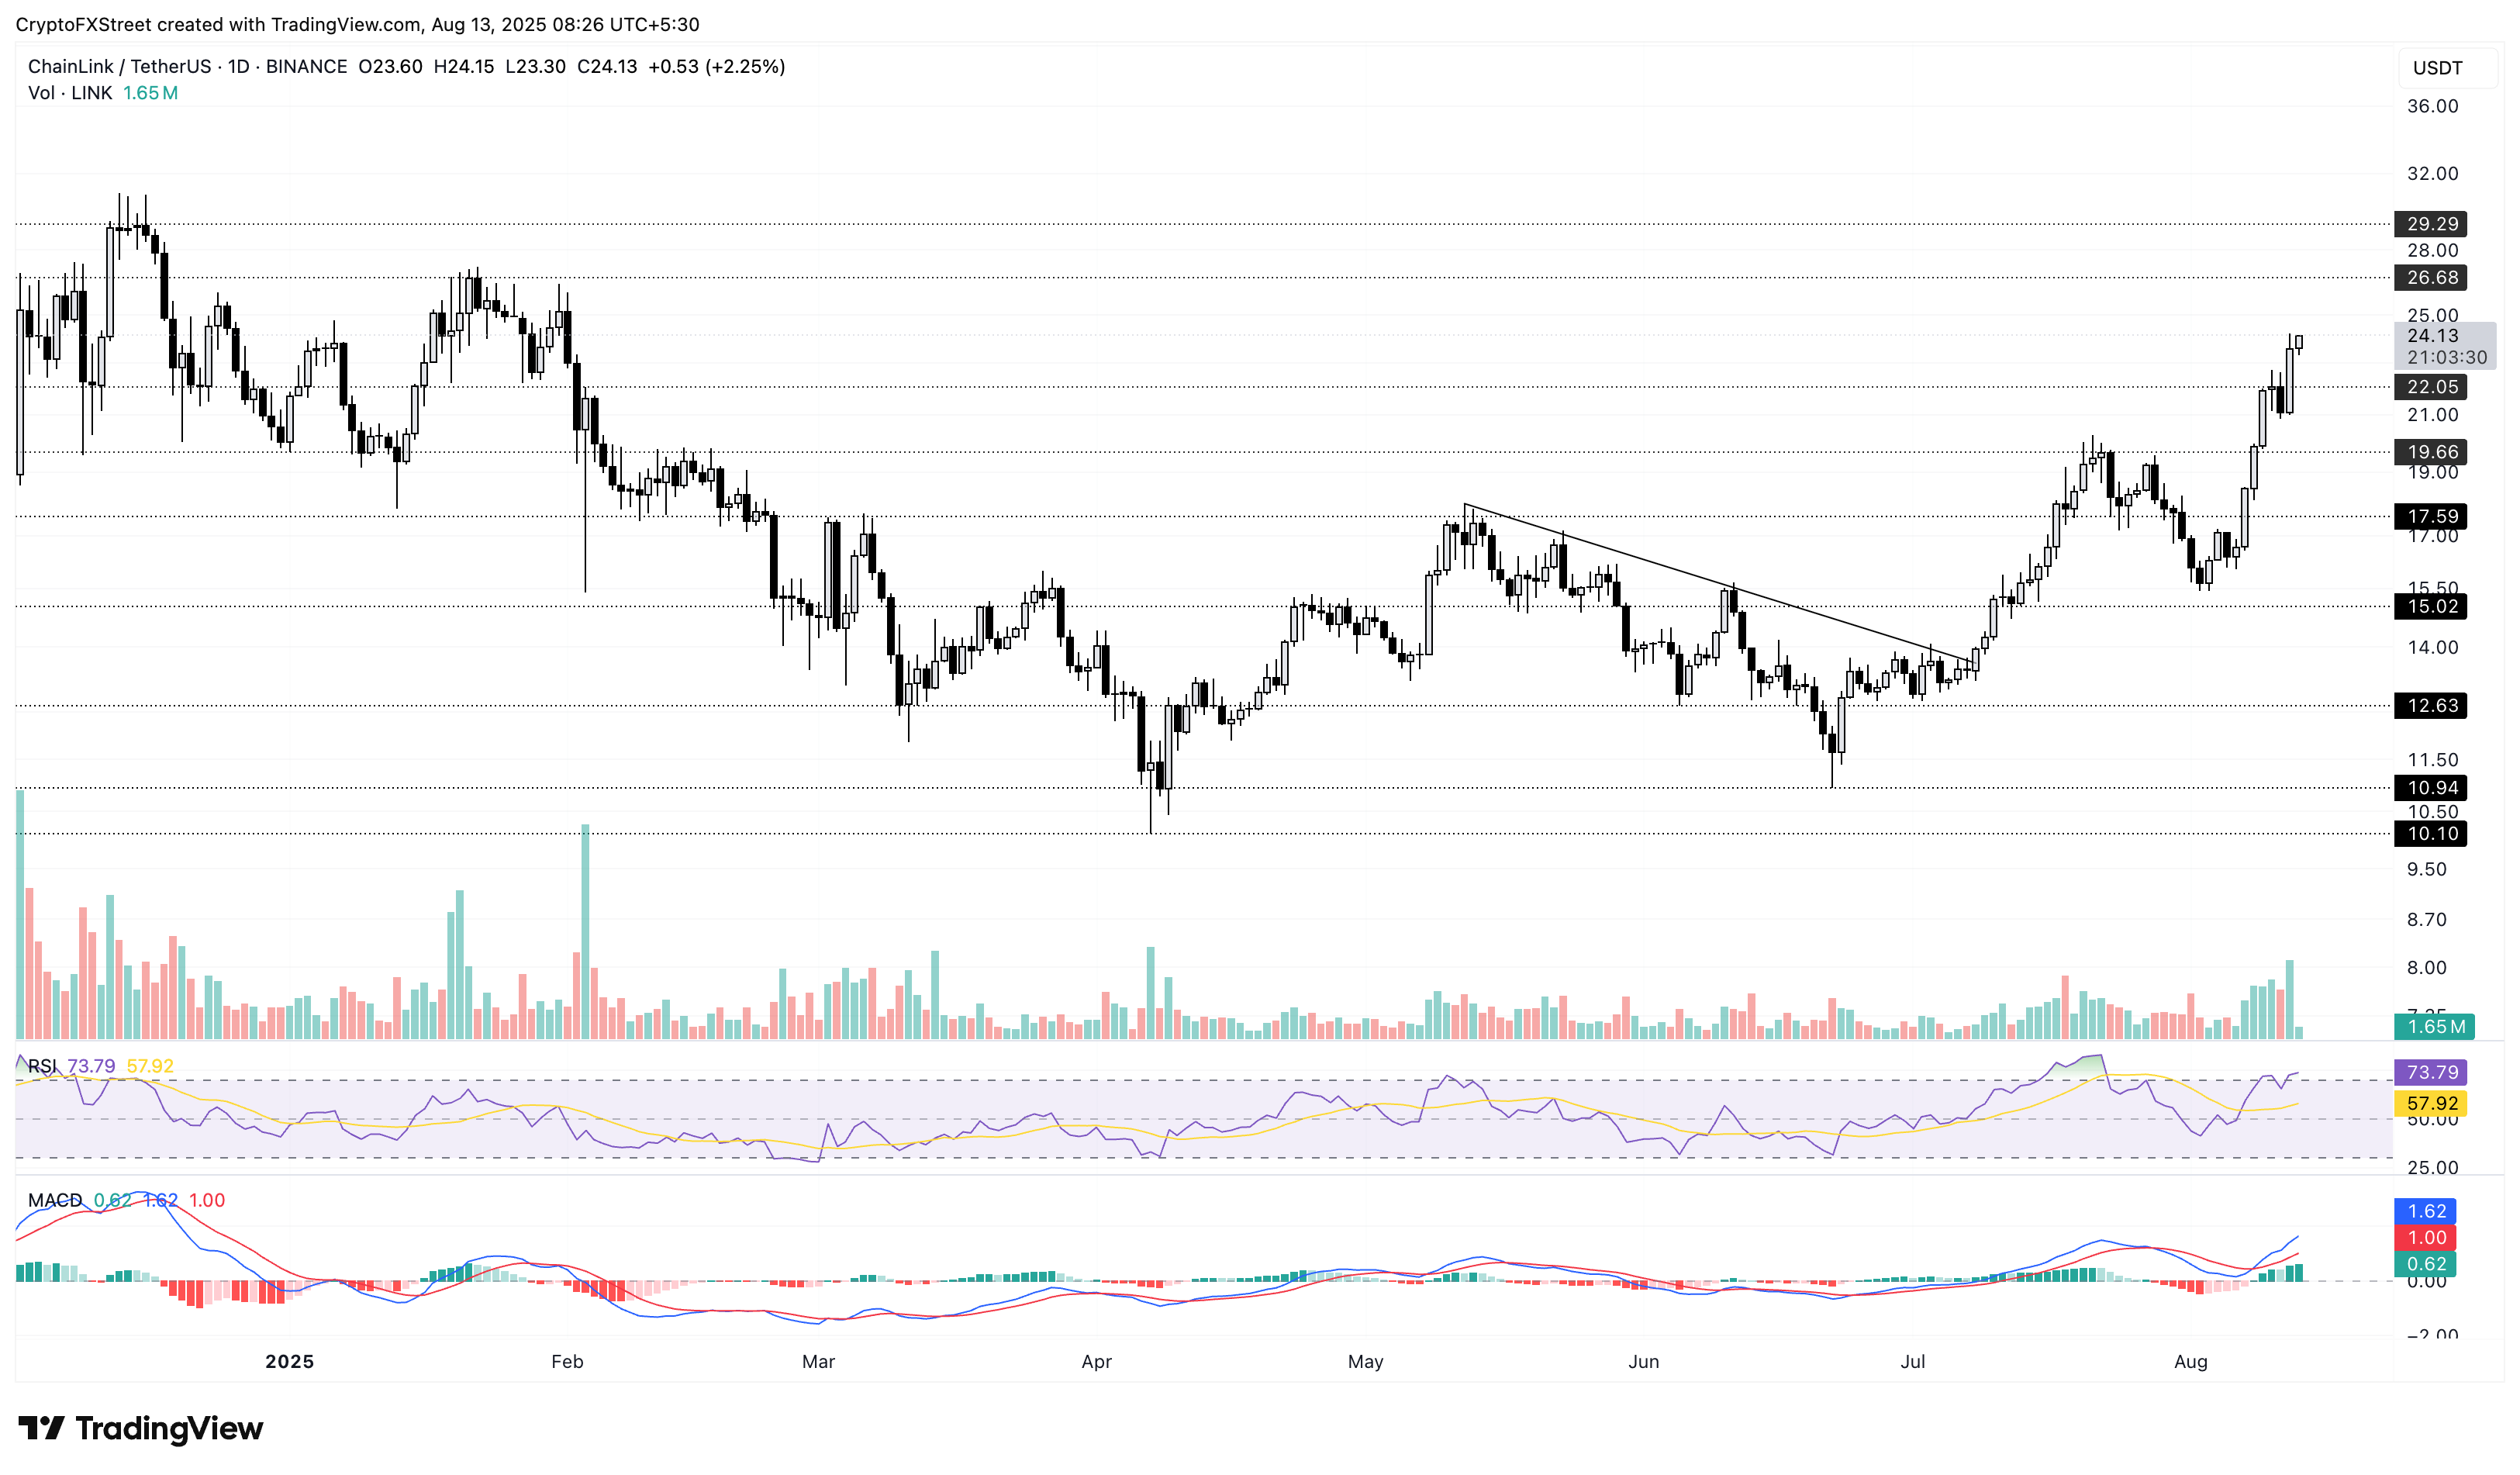
LINK/USDT daily price chart.
On the flipside, LINK could retest the $22.05 support level if the buying pressure cools off.
Solana edges higher towards $200 breakout
Solana has appreciated by 3% so far on Wednesday, extending the 9.69% rise from the previous day. The layer-1 token inches closer to the $200 psychological level as it surpasses the 61.8% Fibonacci level at $191, drawn from the $295 high on January 19 to the $95 low on April 7.
A decisive close above the 61.8% Fibonacci level could extend the uptrend in SOL to the 78.6% Fibonacci level at $232.
The MACD indicator reflects rising bullish momentum, as the MACD line crossed above its signal line on Tuesday, signaling a buy opportunity. Furthermore, the RSI at 64, pointing higher, suggests room for growth.
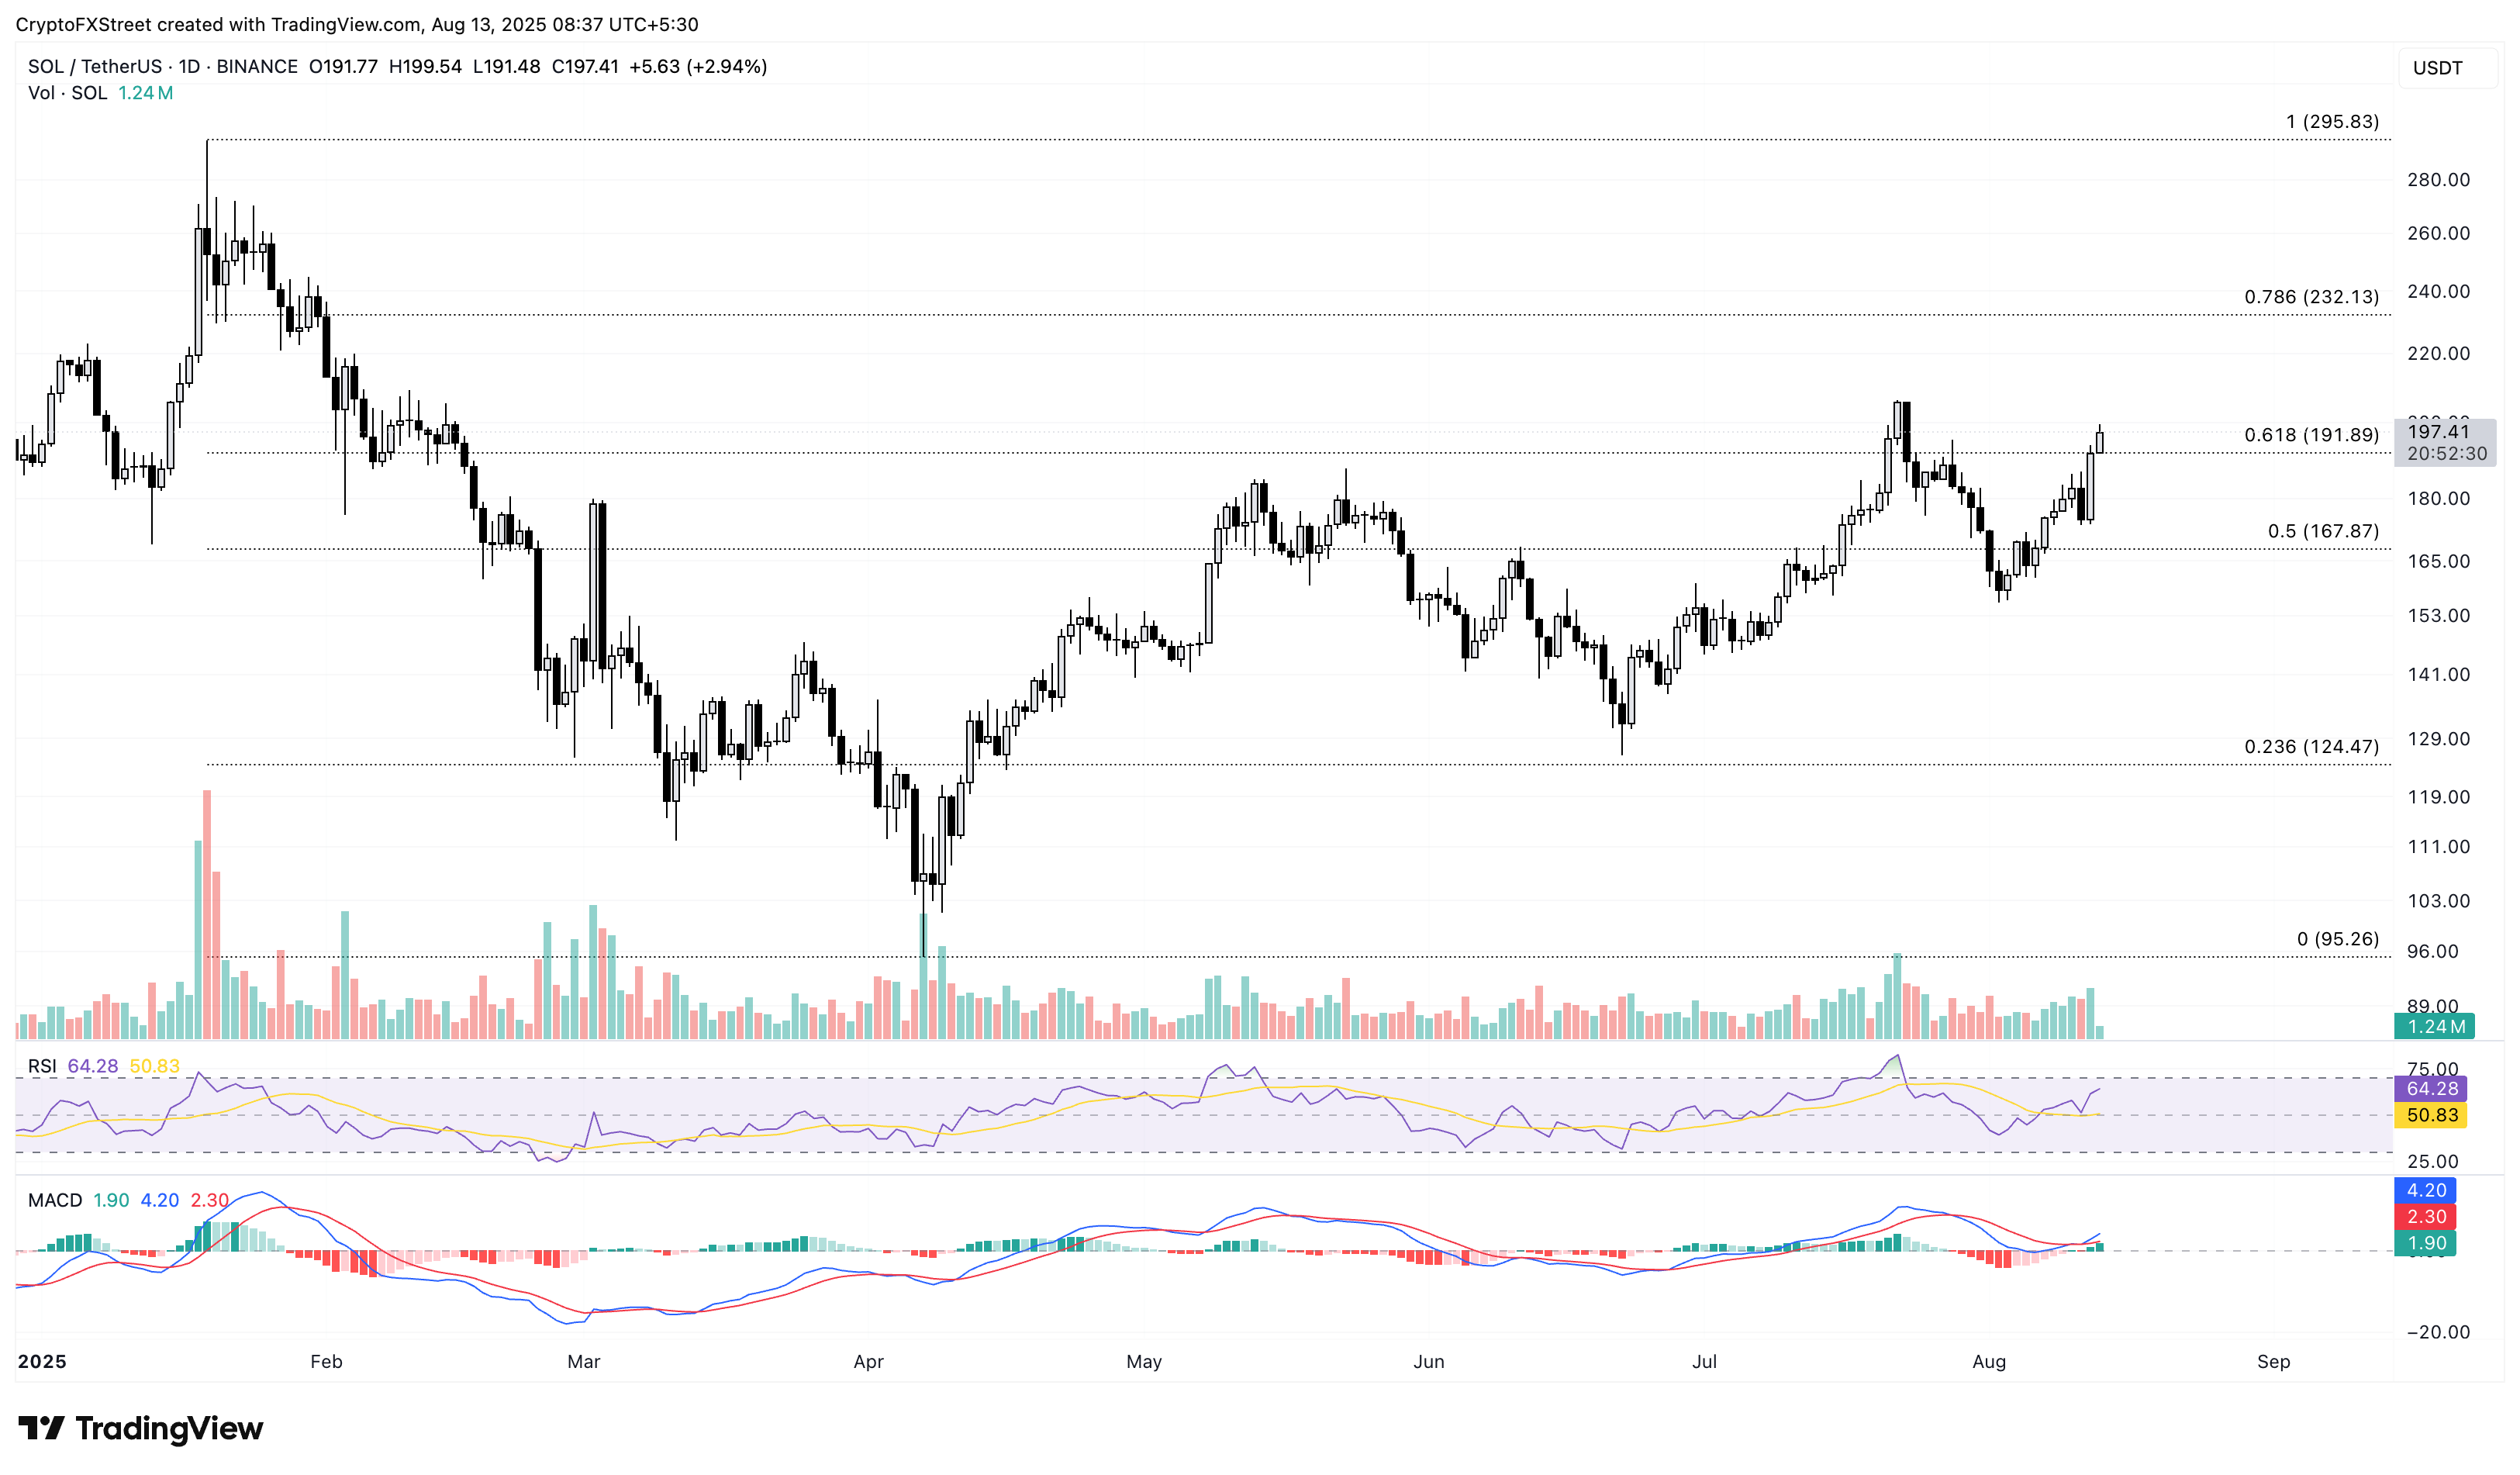
SOL/USDT daily price chart.
On the other hand, a failure to hold above the $191 level could cause SOL to decline towards $167, aligning with the 50% retracement level.
Bài viết đề xuất


