
Bitcoin Price Forecast: BTC stuck below $114,000 as ETF outflows extend to four days
- Bitcoin price hovers around $114,000 on Wednesday after facing rejection from its resistance level at $116,000.
- US-listed spot Bitcoin ETFs recorded an outflow of $196 million on Tuesday, continuing its four-day streak of outflows since the end of July.
- SBI Holdings announced that the company has filed for a dual-asset crypto ETF for BTC and XRP.
Bitcoin (BTC) remains under pressure on Wednesday, trading below $114,000 after a failed attempt to reclaim its $116,000 resistance, as institutional demand weakens further. US-listed spot Exchange Traded Funds (ETFs) recorded $196 million in outflows on Tuesday, extending their losing streak to four consecutive days. Meanwhile, Japan’s SBI Holdings made headlines by filing for a dual-asset crypto ETF, which, if approved, would provide exposure to both BTC and XRP.
Institutional demand continues to weaken
Institutional demand for BTC continues to weaken so far this week. According to the SoSoValue data, US spot Bitcoin ETFs recorded an outflow of $196.18 million on Tuesday, continuing its four-day streak of outflows since the end of July. If these outflow intensities, BTC could see further correction in its price.
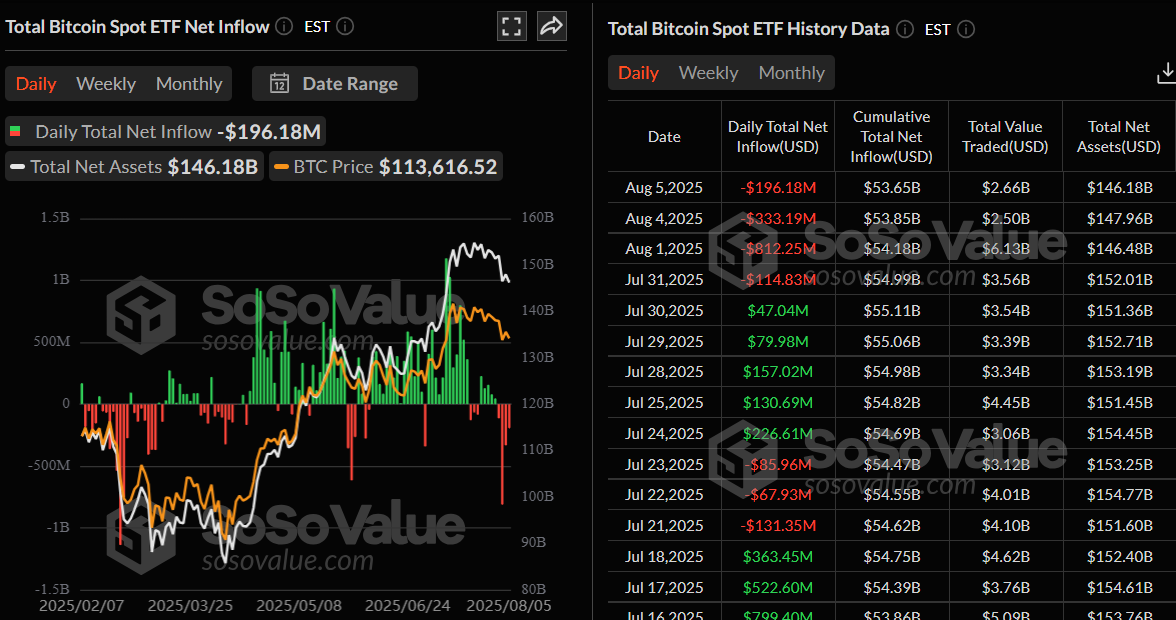
Total Bitcoin Spot ETF Net inflow daily chart. Source: SoSoValue
Weak us data and Trump tariffs weigh
This ongoing weakness in the BTC price comes as the US macroeconomic data on Tuesday, namely the Institute for Supply Management (ISM) Services Purchasing Managers' Index (PMI), slipped to 50.1 in July from 50.8 in June.
Additional details of the report showed that the Employment Index ticked lower to 46.4 from 47.2, and the New Orders Index fell to 50.3 during the reported month from 51.3 in June. This comes on top of softer July US jobs data and underscores the ongoing drag on the economy amid the uncertainty over US President Donald Trump's trade policies, which do not bode well with riskier assets such as Bitcoin.
Market participants should remain cautious, as Trade tariff rates for dozens of countries that haven't reached a deal with the US are expected to go live on Thursday, potentially introducing more uncertainty and volatility into the crypto markets.
SBI Holding files for BTC and XRP ETFs
Japan’s investment firm, SBI Holdings, announced on its Q2 2025 earnings report on Tuesday that the company has filed for a dual-asset crypto Exchange Traded Fund (ETF) for BTC and XRP in Japan’s financial markets.
If approved, it could be bullish in the longer term for Bitcoin and Ripple as it would offer direct exposure to BTC and XRP.
This positive narrative is further supported by the US Securities and Exchange Commission (SEC) statement on Tuesday that clarified that crypto liquid staking activities do not constitute a securities offering, marking a step toward clearer digital asset regulation.
“Today’s staff statement on liquid staking is a significant step forward in clarifying the staff’s view about crypto asset activities that do not fall within the SEC’s jurisdiction,” SEC Chair Paul Atkins said in a statement.
The SEC's guidance on liquid staking comes as Chair Paul Atkins shared the agency's commitment to providing clearer guidance on how federal securities laws apply to crypto.
Paul Atkins announced the "Project Crypto" last week, a regulatory initiative that aims to align securities laws with the advancements in crypto and blockchain. The effort is part of a broader push to make the US the crypto capital of the world under President Donald Trump.
Bitcoin Price Forecast: BTC fails to close above $116,000 resistance
Bitcoin price found support around its 50-day Exponential Moving Average (EMA) at $113,068 on Sunday and recovered slightly until the next day, nearing its lower consolidation at $116,000. However, on Tuesday, it faced a mild correction around the $116,000 resistance. At the time of writing on Wednesday, it continues to trade below $114,000.
If the 50-day EMA at $113,068 fails to hold as support, BTC could close below the previous all-time high of $111,980 on a daily basis. Then, it could extend the decline to retest its key psychological support at $110,000.
The Relative Strength Index (RSI) on the daily chart reads 45, after facing rejection from its neutral level of 50 on Monday, indicating bearish momentum is gaining traction. The Moving Average Convergence Divergence (MACD) showed a bearish crossover on July 23 that still holds, contributing to the bearish momentum.
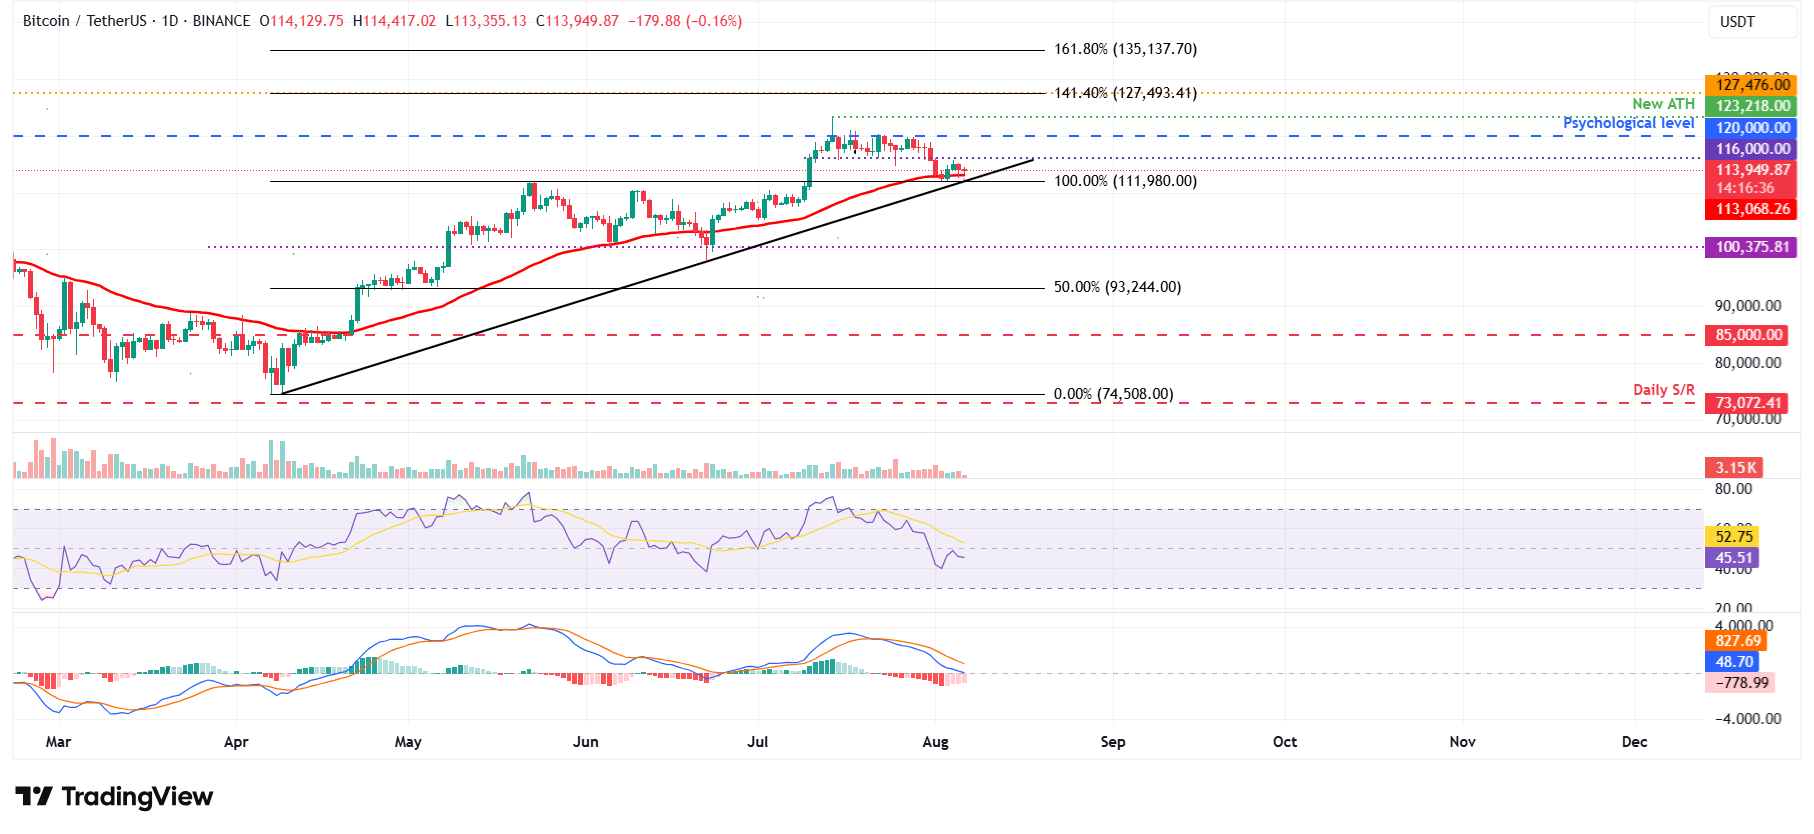
BTC/USDT daily chart
However, if BTC finds support around its 50-day EMA at $113,068, it could extend the recovery toward its key resistance at $116,000.
Bitcoin, altcoins, stablecoins FAQs
Bitcoin is the largest cryptocurrency by market capitalization, a virtual currency designed to serve as money. This form of payment cannot be controlled by any one person, group, or entity, which eliminates the need for third-party participation during financial transactions.
Altcoins are any cryptocurrency apart from Bitcoin, but some also regard Ethereum as a non-altcoin because it is from these two cryptocurrencies that forking happens. If this is true, then Litecoin is the first altcoin, forked from the Bitcoin protocol and, therefore, an “improved” version of it.
Stablecoins are cryptocurrencies designed to have a stable price, with their value backed by a reserve of the asset it represents. To achieve this, the value of any one stablecoin is pegged to a commodity or financial instrument, such as the US Dollar (USD), with its supply regulated by an algorithm or demand. The main goal of stablecoins is to provide an on/off-ramp for investors willing to trade and invest in cryptocurrencies. Stablecoins also allow investors to store value since cryptocurrencies, in general, are subject to volatility.
Bitcoin dominance is the ratio of Bitcoin's market capitalization to the total market capitalization of all cryptocurrencies combined. It provides a clear picture of Bitcoin’s interest among investors. A high BTC dominance typically happens before and during a bull run, in which investors resort to investing in relatively stable and high market capitalization cryptocurrency like Bitcoin. A drop in BTC dominance usually means that investors are moving their capital and/or profits to altcoins in a quest for higher returns, which usually triggers an explosion of altcoin rallies.
Bài viết đề xuất


