
Ethena Price Forecast: ENA teases bullish reversal amid OKX listing
- Ethena holds at a crucial support level, hinting at a potential double bottom reversal.
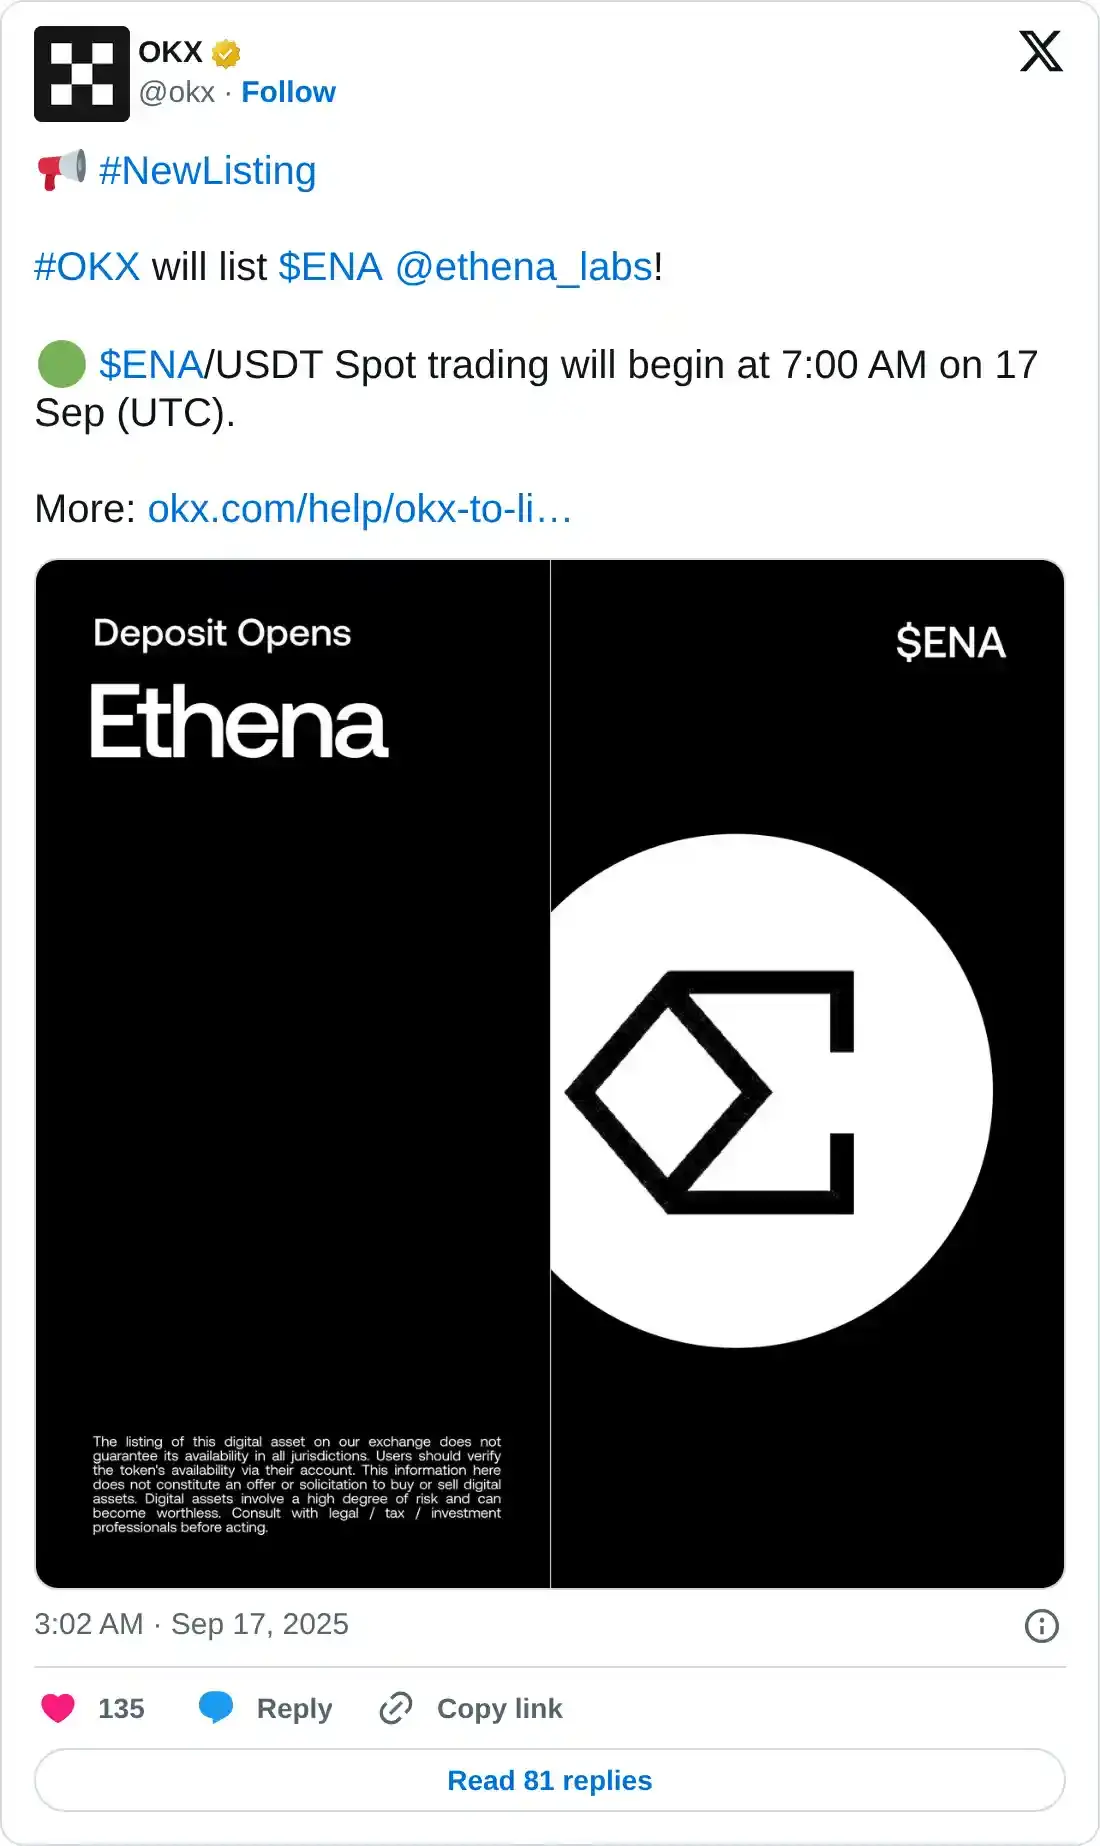
- OKX exchange will list the ENA token on Wednesday.
- The derivatives market flashes mixed signals as Open Interest declines amid long positions buildup.
Ethena (ENA) price trades below the $0.7000 level at press time on Wednesday, extending the downfall for the fifth consecutive day. Still, the derivative and technical outlook present a bullish reversal possibility amid OKX’s announcement of ENA listing on Wednesday.
OKX’s announcement of listing ENA aligns with high-volume activity
OKX exchange will list Ethena’s ENA token at 07:00 GMT, allowing its users to trade ENA against Tether’s USDT, which could boost the trading volume and market price. However, the ENA withdrawals from the exchange will begin at 10:00 GMT.
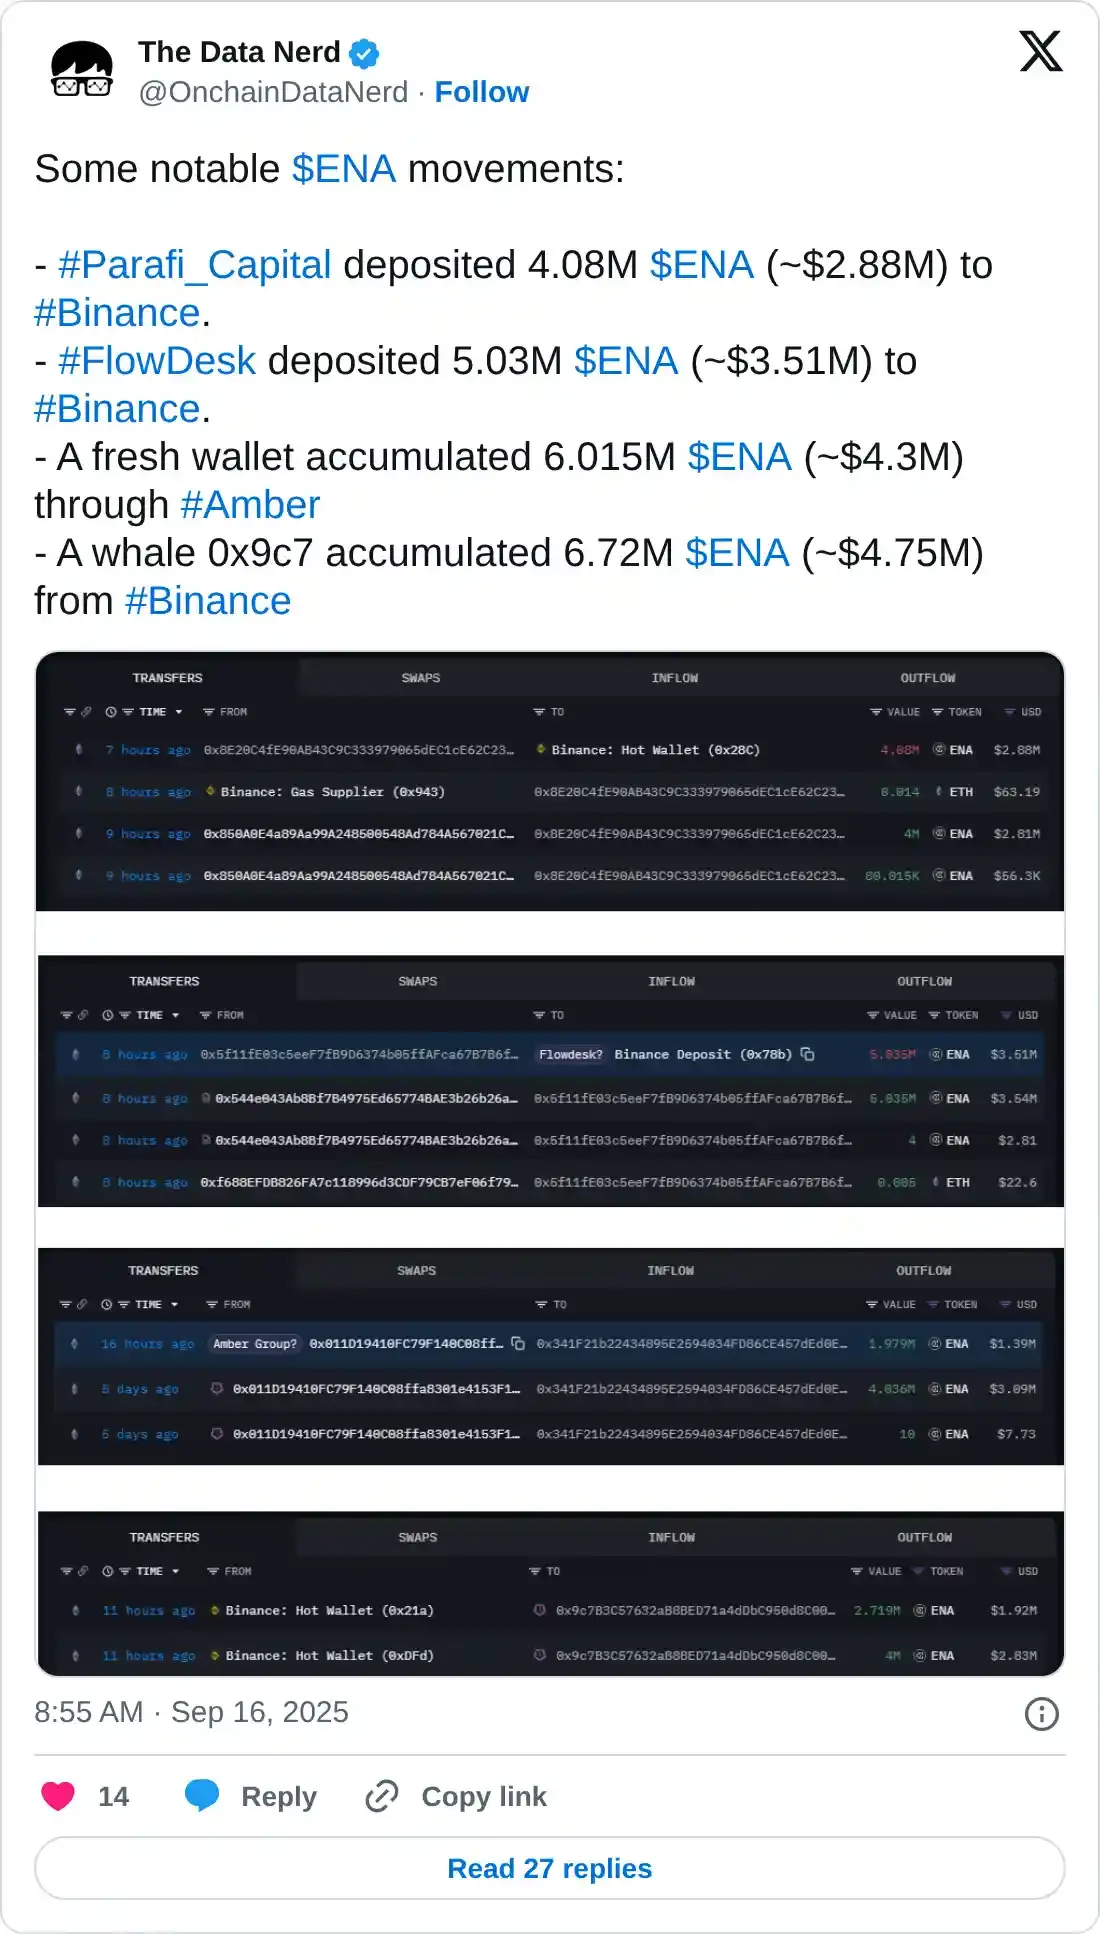
Amid the possibility of listing gains, high-volume on-chain activity indicates increased confidence among large-wallet investors, popularly called whales, while corporates offload. In a recent X post, The Data Nerd, an on-chain specialist, has shared that Parafi Capital and Flowdesk have deposited 4.08M ENA and 5.03M ENA to Binance.
Still, a newly created wallet has accumulated 6.015M ENA through Amber, and a different wallet accumulated 6.72M ENA from Binance, indicating increased demand among whales.
Bulls build positions, ignoring Open Interest decline
CoinGlass data shows that the Ethena Open Interest (OI) has dropped by 1.26% in the last 24 hours, standing at $1.57 billion. This capital outflow from Ethena derivatives indicates a decline in active positions and lowered interest among traders.
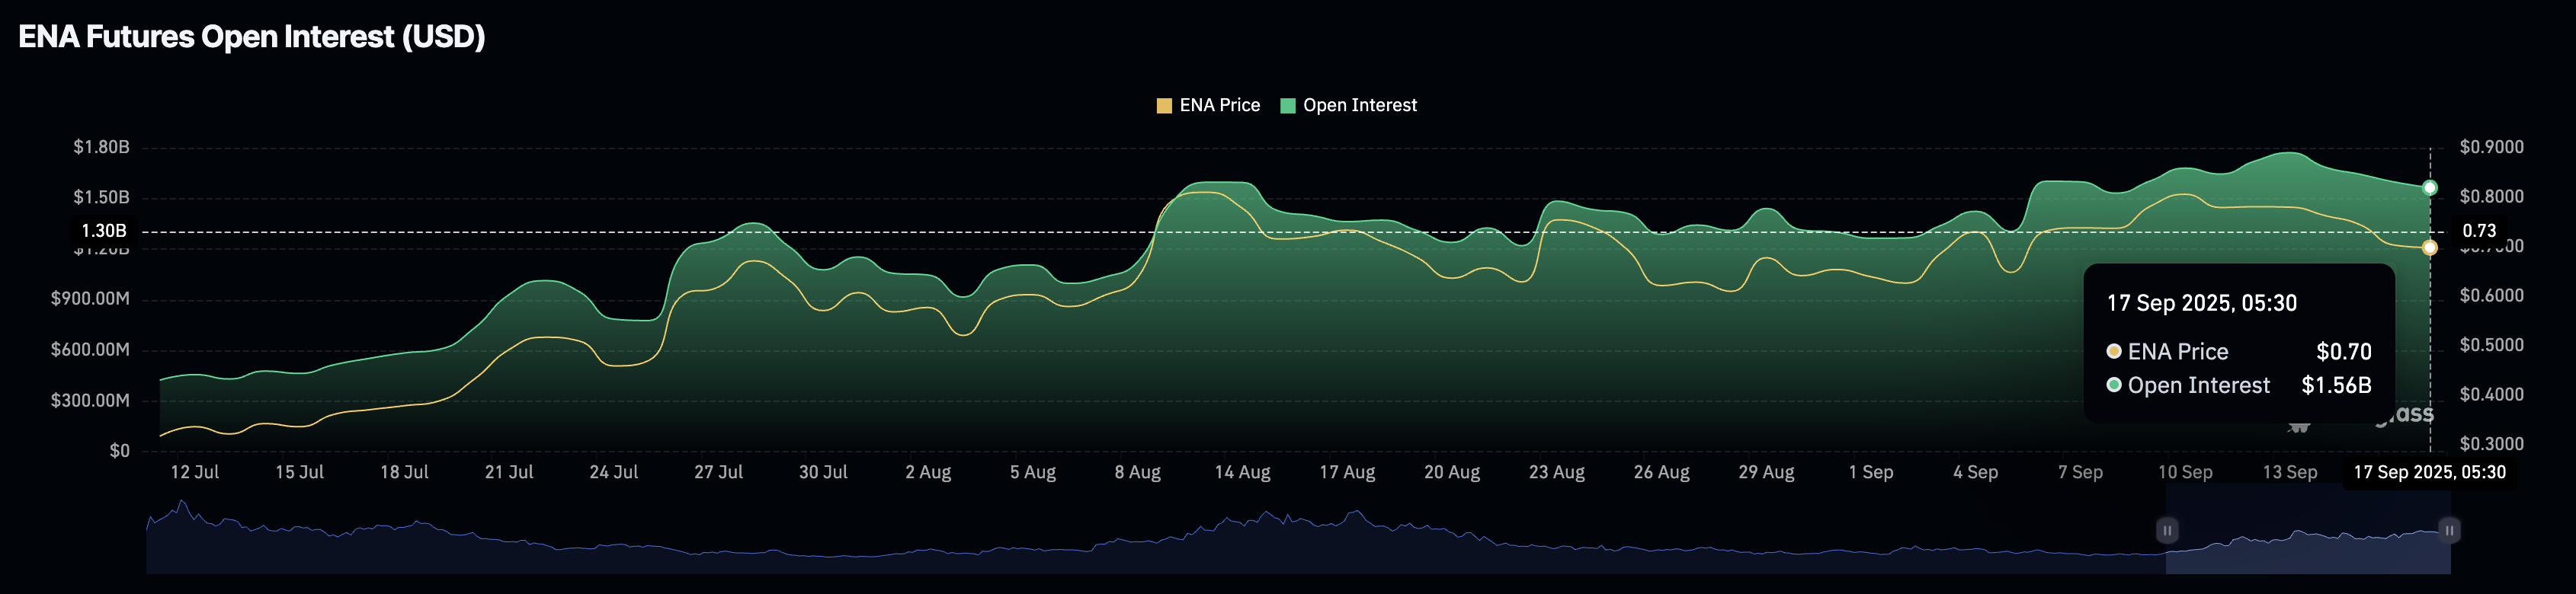
ENA Open Interest. Source: CoinGlass
Still, the active positions suggest a bullish bias as the OI-weighted funding rate remains positive at 0.0023% indicating that buyers are paying a premium to hold long positions, necessary to balance spot and swap prices.
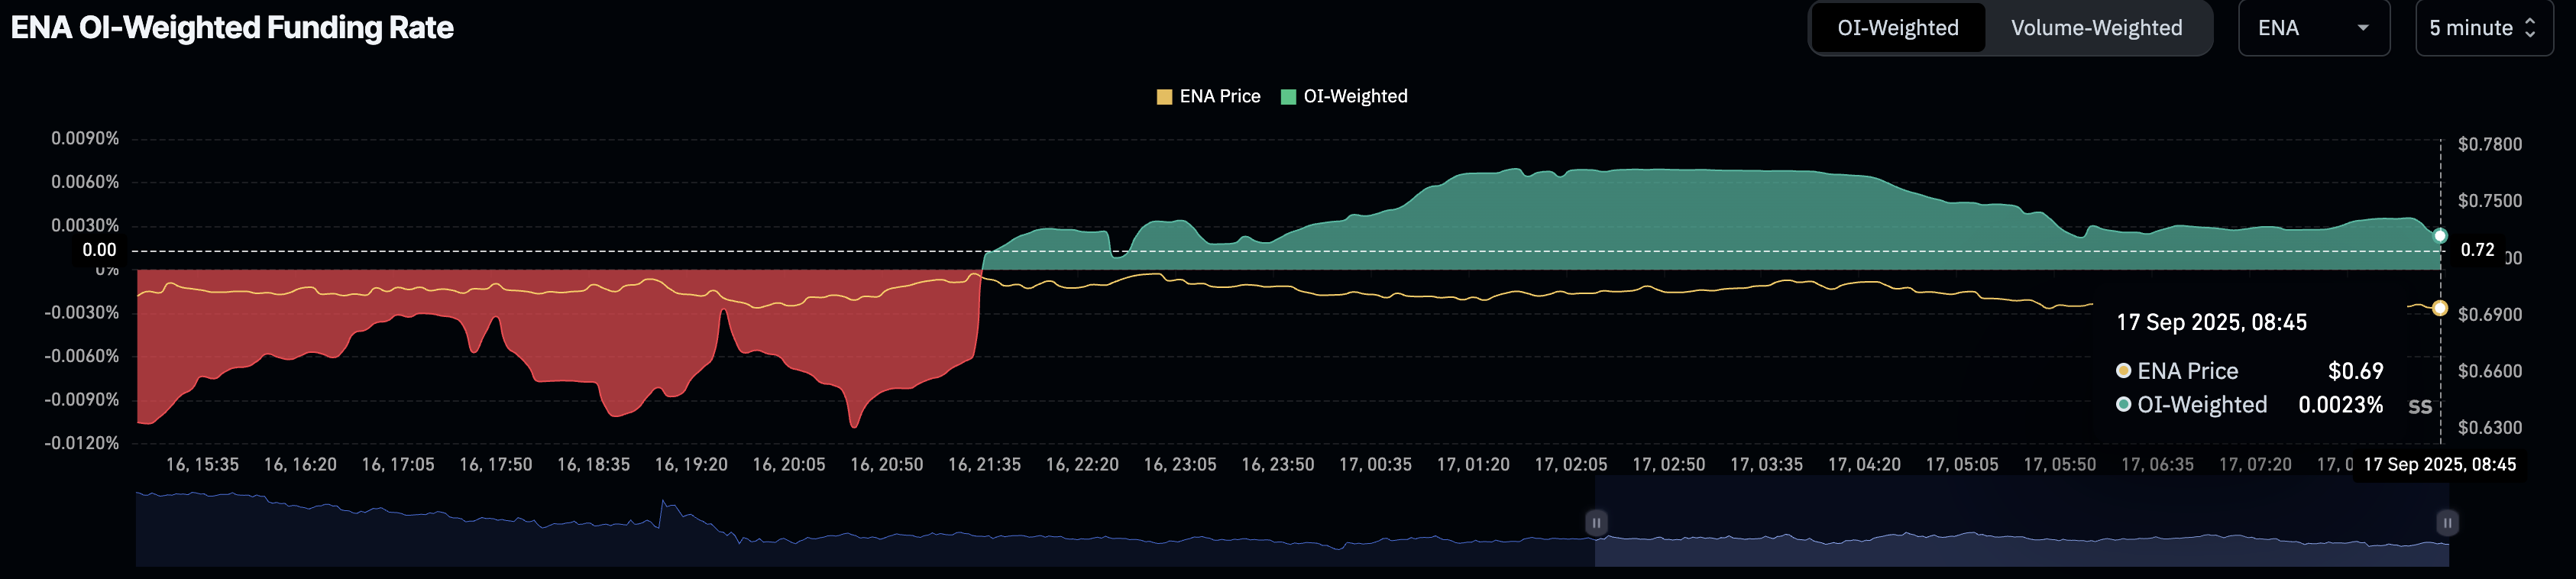
ENA OI-weighted funding rate. Source: CoinGlass
Additionally, the Taker buy volume maintains a steady rise to 49.18%, from 45.81% on Saturday, indicating a significant increase in long positions.
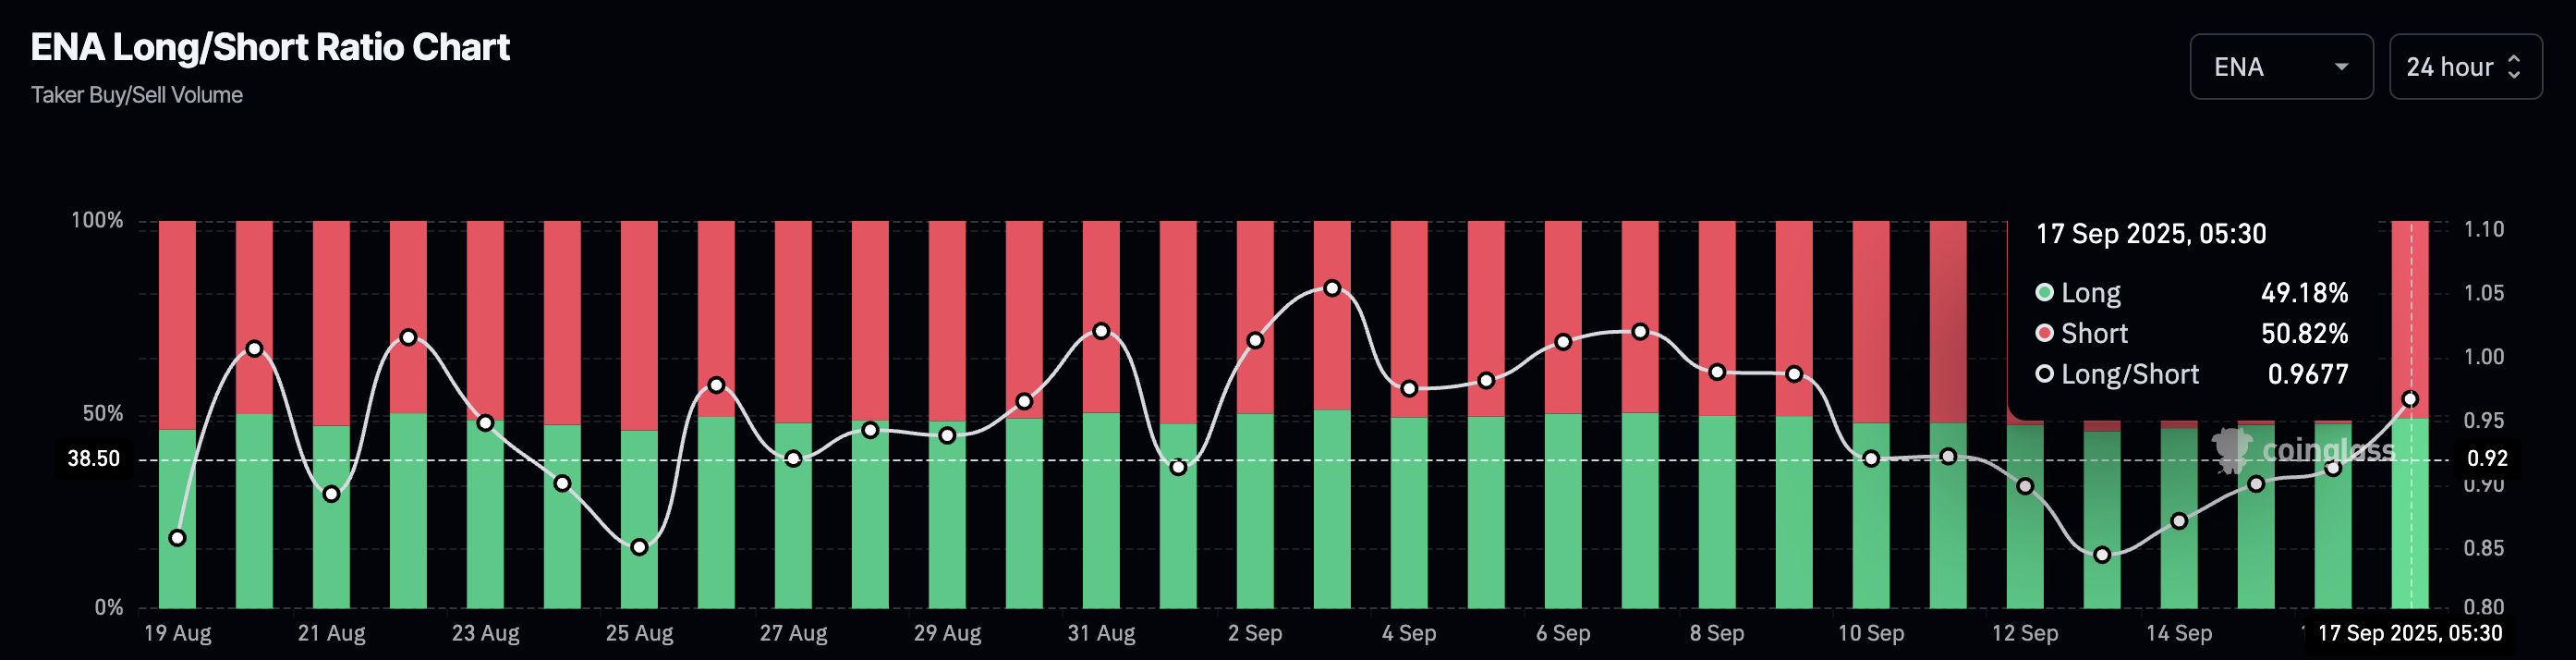
ENA long/short ratio. Source: CoinGlass
Ethena prepares for a double-bottom reversal
Ethena holds above a crucial support level of $0.6837 at the time of writing on Wednesday, hinting at a double bottom reversal on the 4-hour chart. The Relative Strength Index (RSI) at 35 is higher compared to the previous bottom position, indicating a bullish divergence, which is considered a buy signal.
Additionally, the Moving Average Convergence Divergence (MACD) moves closer to its signal line, hinting at a potential crossover that will mark a bullish shift in trend momentum.
If ENA bounces back from the support level above the $0.7000 level, it will confirm the double bottom reversal, and potentially target the 100-period Exponential Moving Average (EMA) at $0.7290.
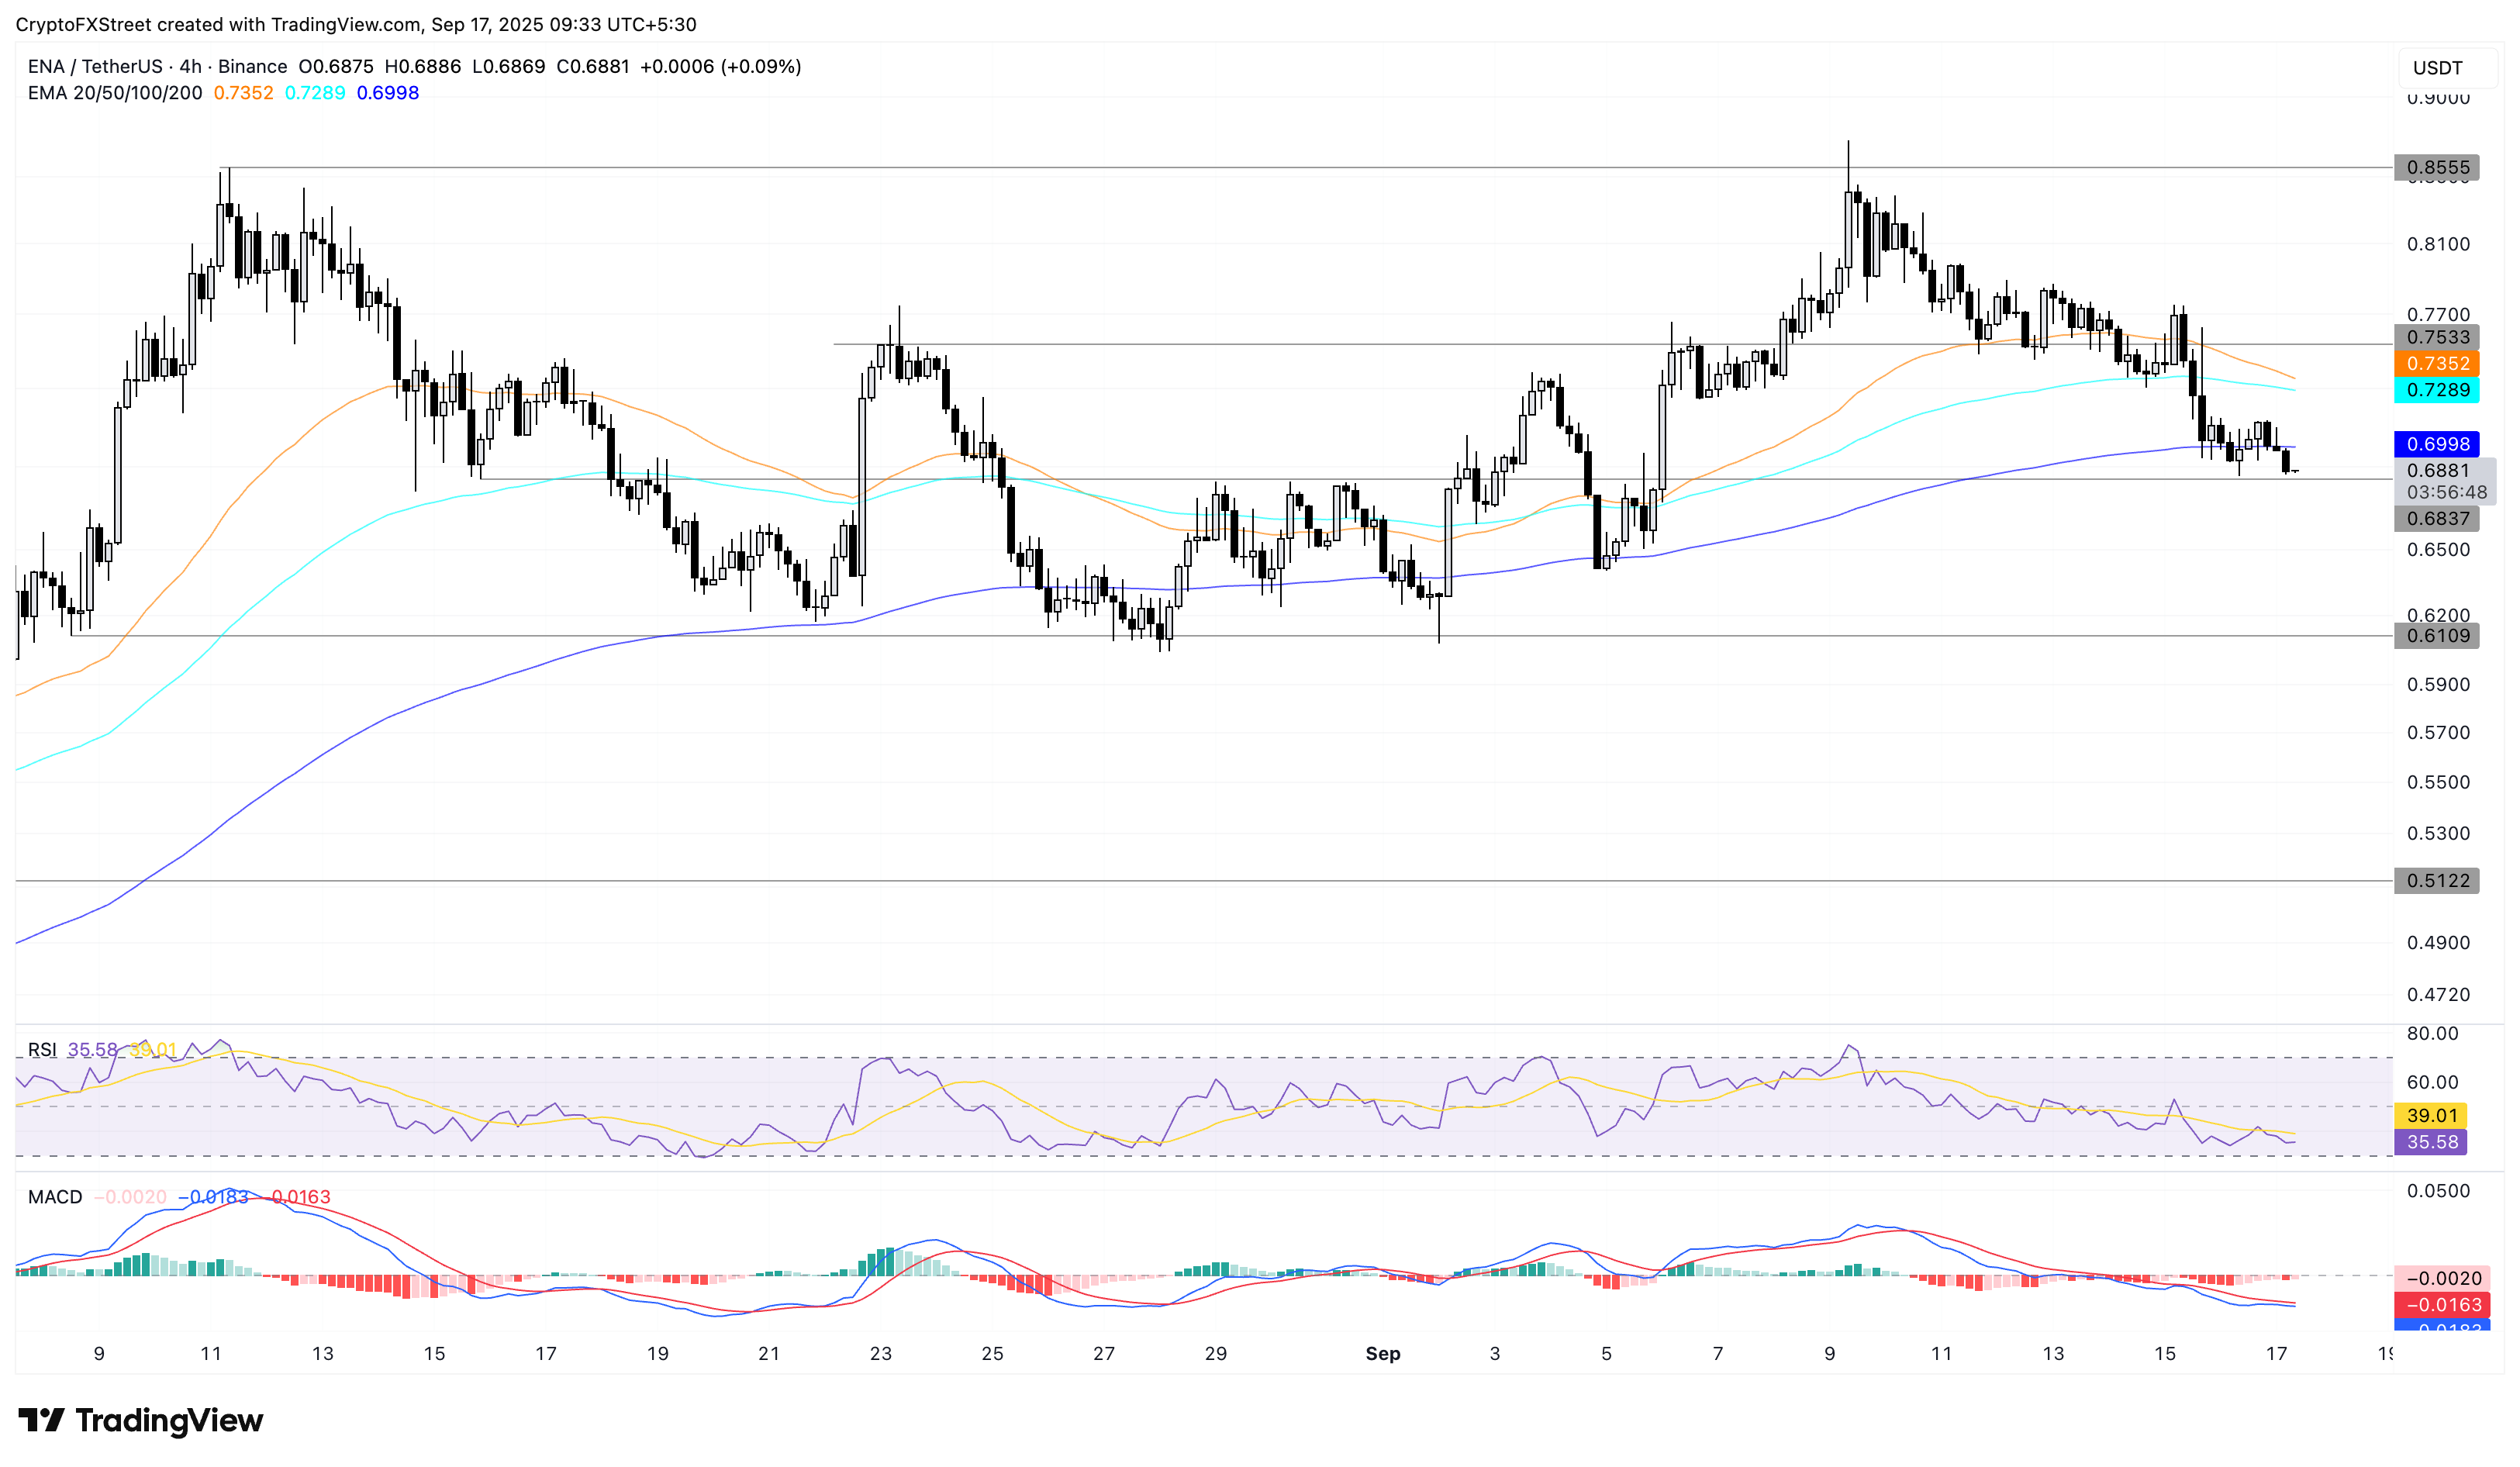
ENA/USDT 4-hour price chart.
On the contrary, if Ethena drops below the $0.6837 level, it could result in a freefall to $0.6109, last tested on September 2.
Bài viết đề xuất


