
Hyperliquid jumps 6% as Binance US announces HYPE token spot listing plans
- Binance US has announced an upcoming Hyperliquid token listing in the spot market.
- The derivatives data shows a record-high surge in open interest, flashing increasing bullish interest.
- HYPE’s technical outlook suggests the possibility of forging a new all-time high .
Hyperliquid (HYPE) edges lower by over 1% at press time on Tuesday after a 6.73% rise on Monday. The bullish trend anticipation in Hyperliquid’s derivatives market grows as its Open Interest (OI) surges to an all-time high after Binance US announces the HYPE spot trading feature coming soon. The technical outlook supports the prolonged bull run thesis, potentially reaching a new all-time high.
HYPE to list on Binance US spot market
In a recent tweet, the US arm of Binance has announced an upcoming spot listing for Hyperliquid’s HYPE token. At the time of writing, Binance offers HYPE perpetual future trading, holding an Open Interest of $17.32M on the platform alone.
With the 24-hour spot trading volume of Binance at $14.94 billion and $65 billion in derivatives trading volume, Binance is the largest Centralized Crypto Exchange (CEX). A spot listing on Binance US will bring additional volume exposure to Hyperliquid, hinting at potential listing gains.
HYPE open interest hits all-time high
CoinGlass data shows HYPE OI reaching a record high at $1.43 billion, a surge of $140 million in the last 24 hours. Typically, rising OI relates to additional funds entering the market to boost buying pressure, which could prolong Hyperliquid’s recovery.
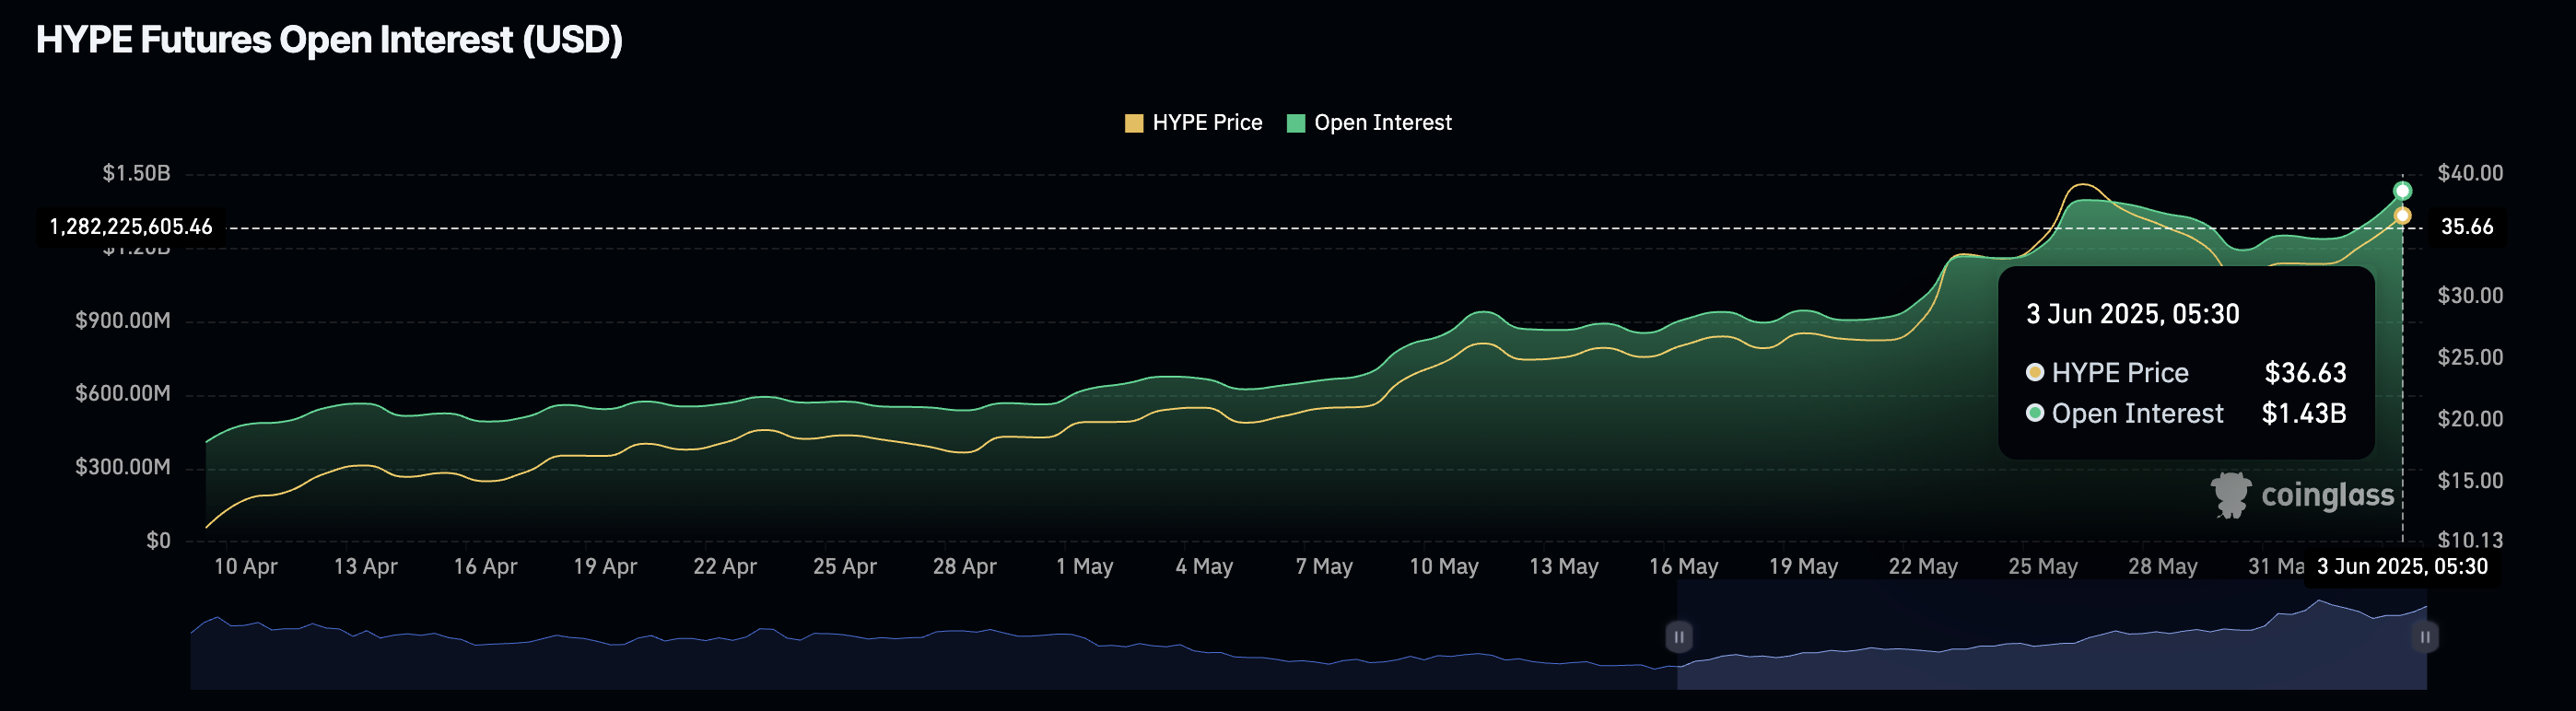
HYPE Futures Open Interest (USD). Source: Coinglass
An additional signal supporting the bullish thesis is the spike in OI-weighted funding rate to 0.0368%. A rising positive funding rate relates to increased fees on buyers to align the derivatives market price, which is rising due to increased bullish activity, with the spot market price.
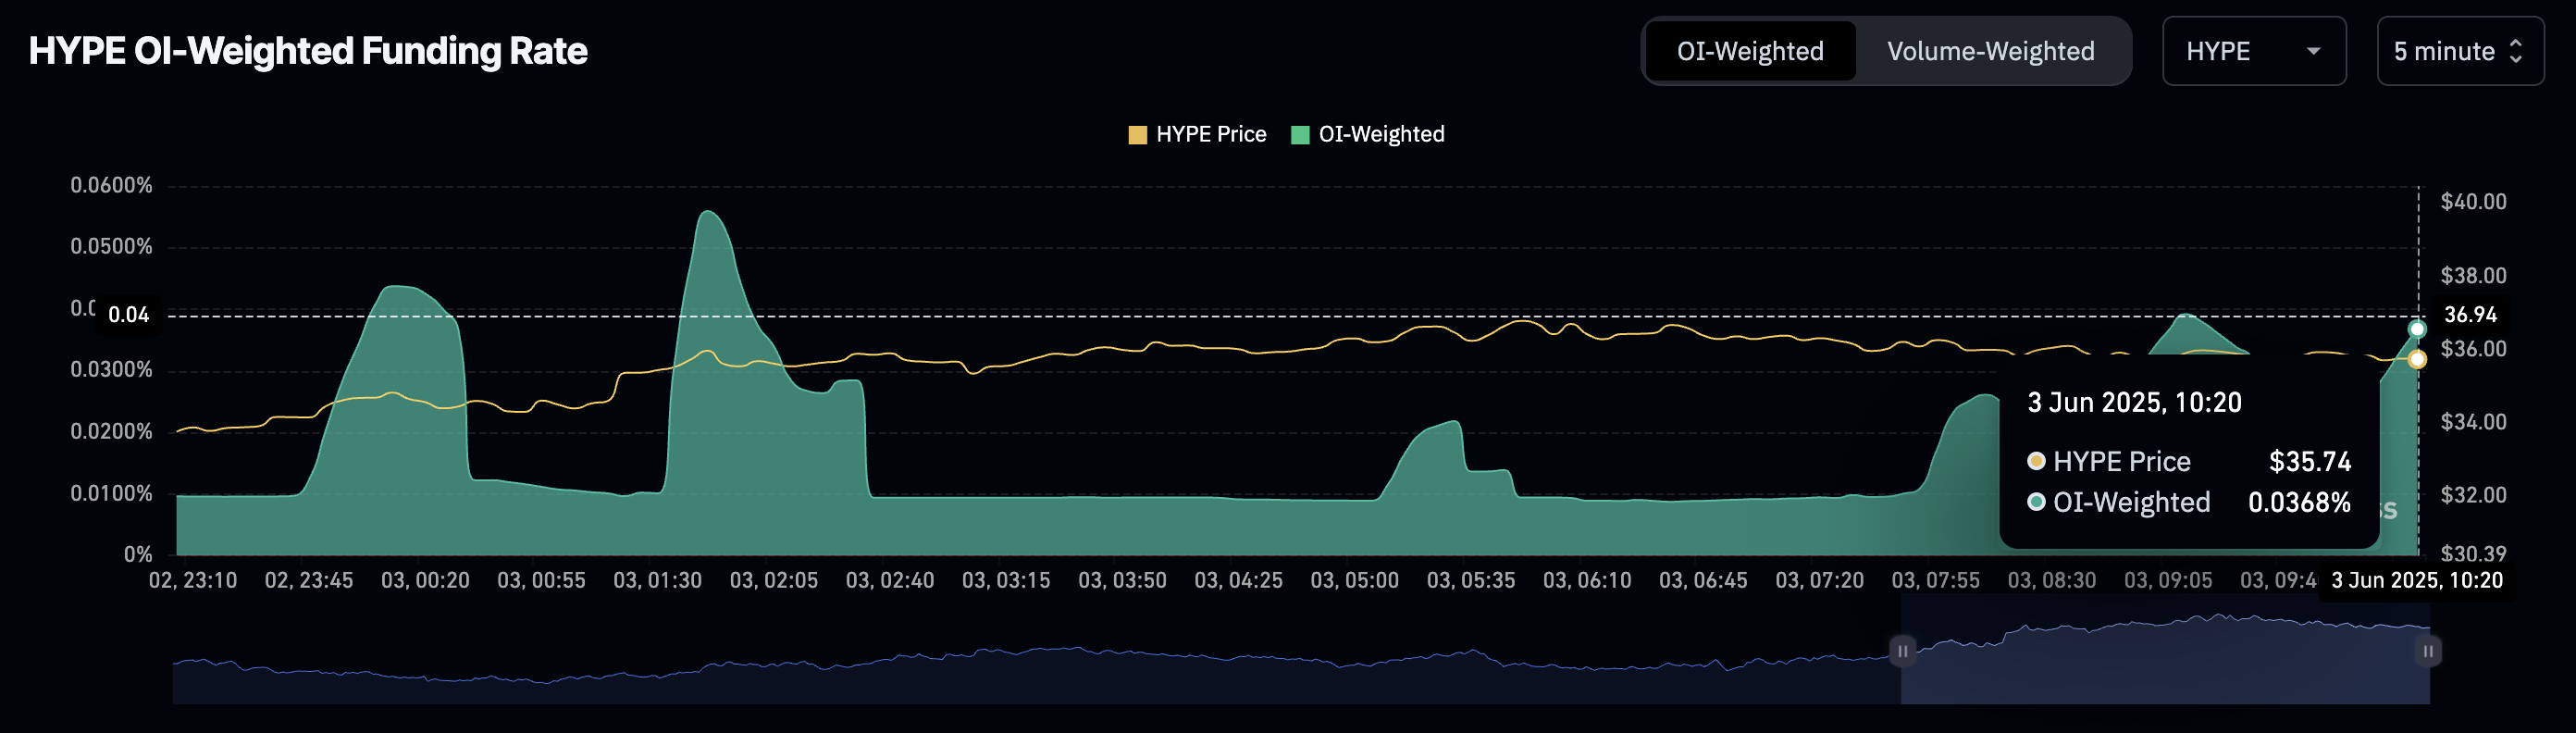
HYPE OI-Weighted Funding Rate. Source: Coinglass
Hyperliquid targets a bullish pattern breakout
Hyperliquid witnessed a 63% rally in May, reaching an all-time high at $40 before retracing to $30. HYPE has surged over 9% so far in June, bouncing off a support trendline formed by the lows on April 28, 30, May 6, 20, and 31.
The price action reveals the possibility of a rounding bottom formation with the $39 level acting as the neckline. However, the recovery in altcoin faces a block to extend the reversal rally beyond $36.
If HYPE manages to sustain an uptrend, crossing above the $39 neckline, the pattern breakout signals 27% upside to almost $50, calculated by adding the pattern’s depth to the breakout point.
The momentum indicators flash a surge in bullish momentum: The Moving Average Convergence/Divergence (MACD) reveals a bullish crossover with its signal line, rising above the center line. Further up, the Relative Strength Index (RSI) at 60 points rising from the oversold boundary signals a sharp surge in buying pressure.
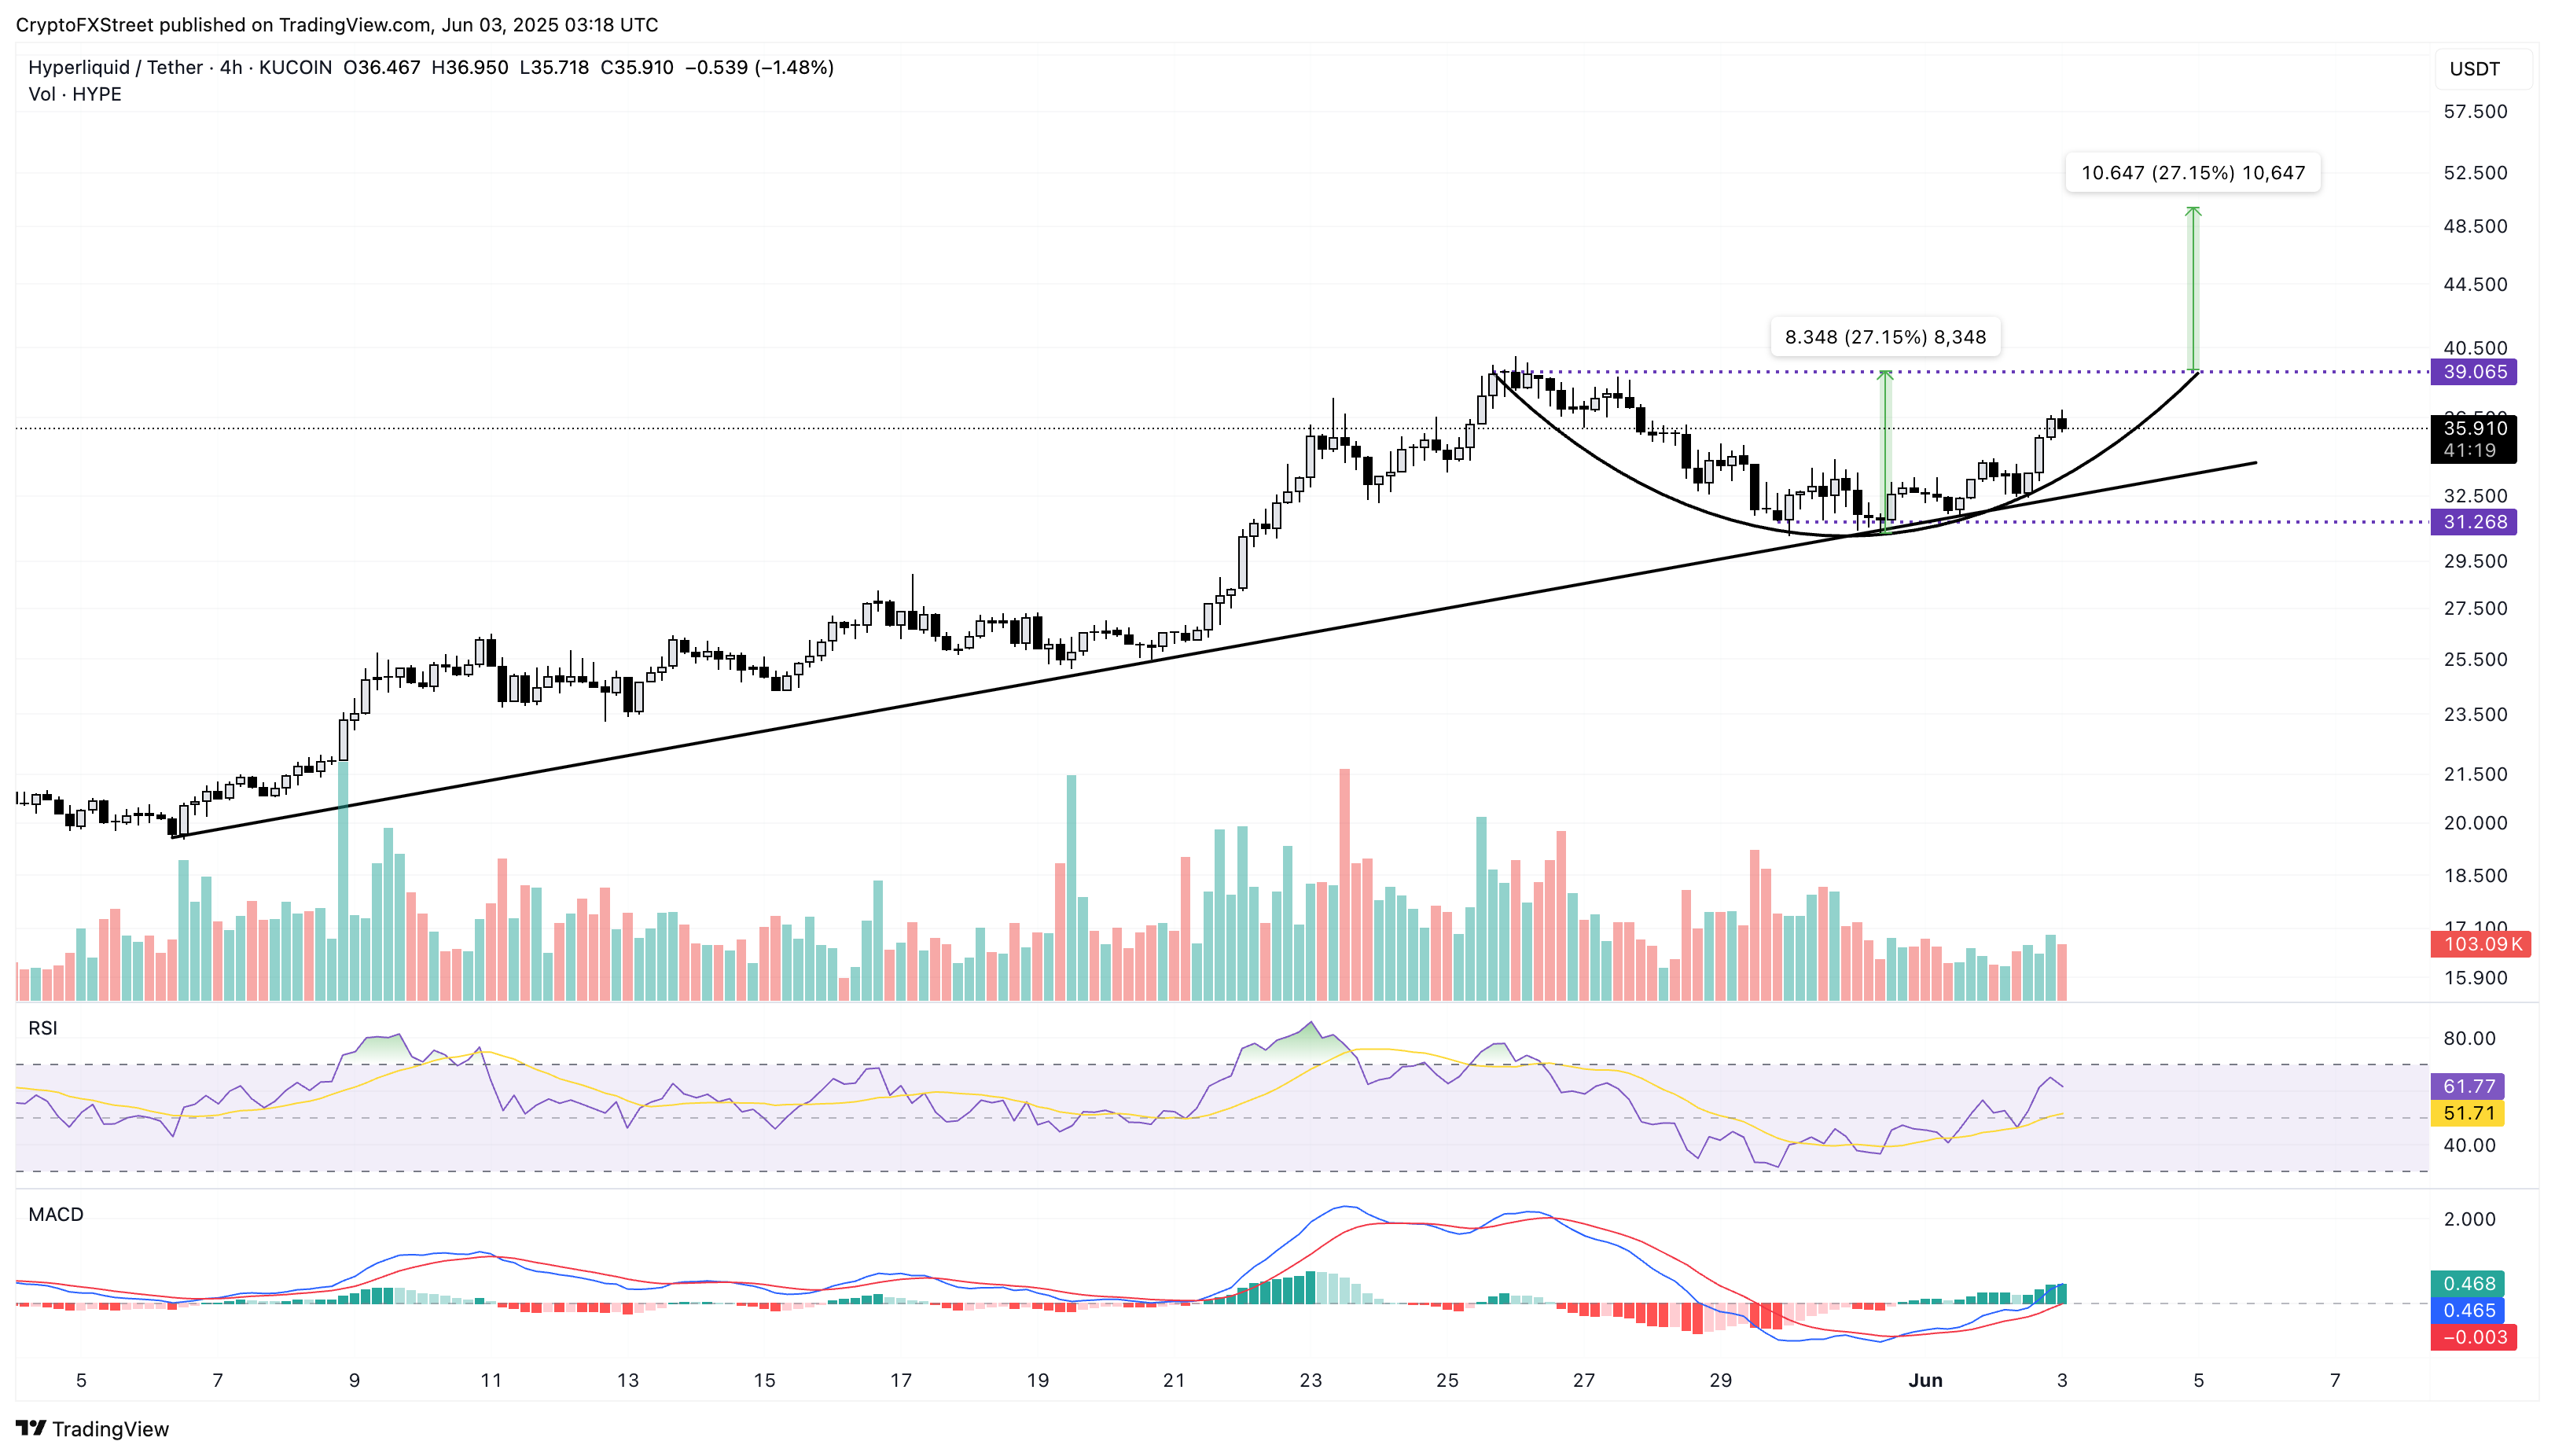
HYPE/USDT 4-hour price chart. Source: Tradingview
However, if HYPE reverses, it could extend a decline to the $31.26 support level.
Bài viết đề xuất


