


Bitcoin Price Forecast: BTC stalls below $76,000 amid ETF outflows, persisting Middle East uncertainty
- Bitcoin stalls below $76,000 on Wednesday after losing support from the key EMAs.
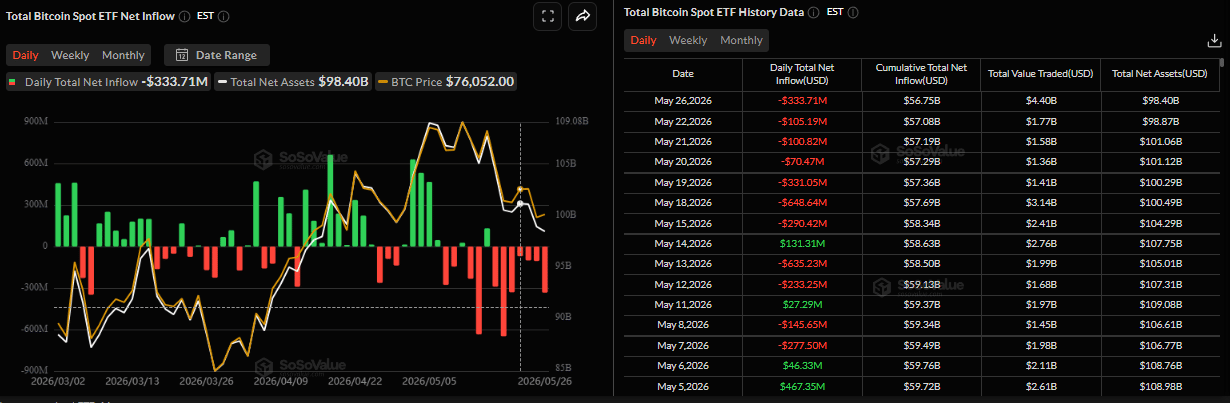
- US-listed spot ETFs recorded an outflow of $333.71 million on Tuesday, marking the seventh consecutive day of withdrawals.
- Uncertainty in the Middle East deepens as Iran says new US strikes violated the ceasefire, fueling geopolitical risk and keeping risk appetite subdued.
Bitcoin (BTC) stalls below $76,000, trading cautiously on Wednesday after losing support from the key Exponential Moving Averages (EMAs). Institutional demand continues to fade with spot Exchange Traded Funds (ETFs) recording steady outflows since mid-May. In addition, uncertainty in the Middle East deepens as Iran says new US strikes violated the ceasefire, fueling geopolitical risk and keeping risk appetite subdued.
Selling continues
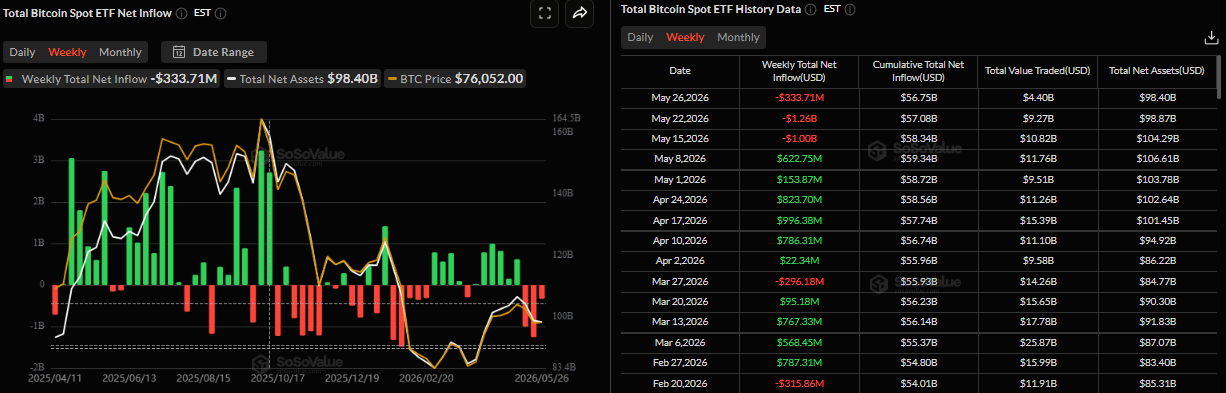
Institutional demand has continued to fade so far this week. SoSoValue data showed the spot ETFs recorded an outflow of $333.71 million on Tuesday, marking the seventh consecutive day of withdrawals since mid-May. Moreover, the weekly data show steady institutional selling, totaling $2.26 billion over the past two weeks. If this trend continues this week, BTC could see further correction.
US attacks complicate efforts to bring the war to a close
On Tuesday, Iran’s Islamic Revolutionary Guard Corps (IRGC) threatened retaliation after the US carried out strikes on southern Iran, which were described as “self-defense” by the US Central Command.
“Iran said the US had violated a ceasefire by striking targets near the contested Strait of Hormuz, potentially complicating efforts to bring the war to a close,” Reuters reported.
Further straining peace efforts, Israel pounded Lebanon with more than 120 air strikes on Tuesday in one of the heaviest days of bombing in weeks, Lebanese security sources said. Iran has sought an end to Israeli attacks in Lebanon as part of any deal.
However, negotiations between the US and Iran over ending the war in the Middle East and reopening the Strait of Hormuz continue through mediators.
These mixed developments are keeping Bitcoin sentiment cautious as of Wednesday, limiting investors’ appetite for risk and capping the Crypto King’s upside momentum.
Squeeze in either direction
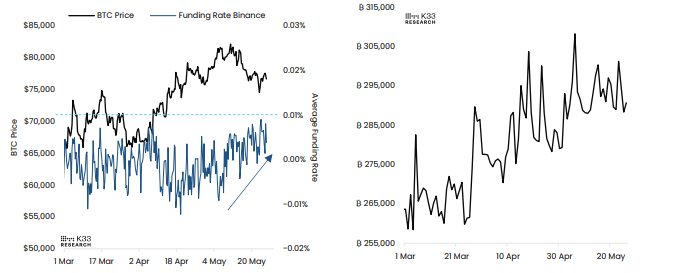
Traders should be cautious as the K33 Research reported that BTC’s perpetual market conditions remain relatively subdued, with few notable changes over the past week.
The chart below shows that funding rates trended higher over the past week, with the annualized 7-day average rising to 5.3% on Tuesday, its highest level since January. Meanwhile, open interest has remained broadly stable, fluctuating between 285,000 and 300,000 BTC throughout the week.
“A significant share of the open interest growth seen over the past three months was established during the negative funding regime, continuing to leave the market vulnerable to squeezes in either direction,” noted K33’s Research analyst.
Bitcoin Price Forecast: BTC closes below key EMAs
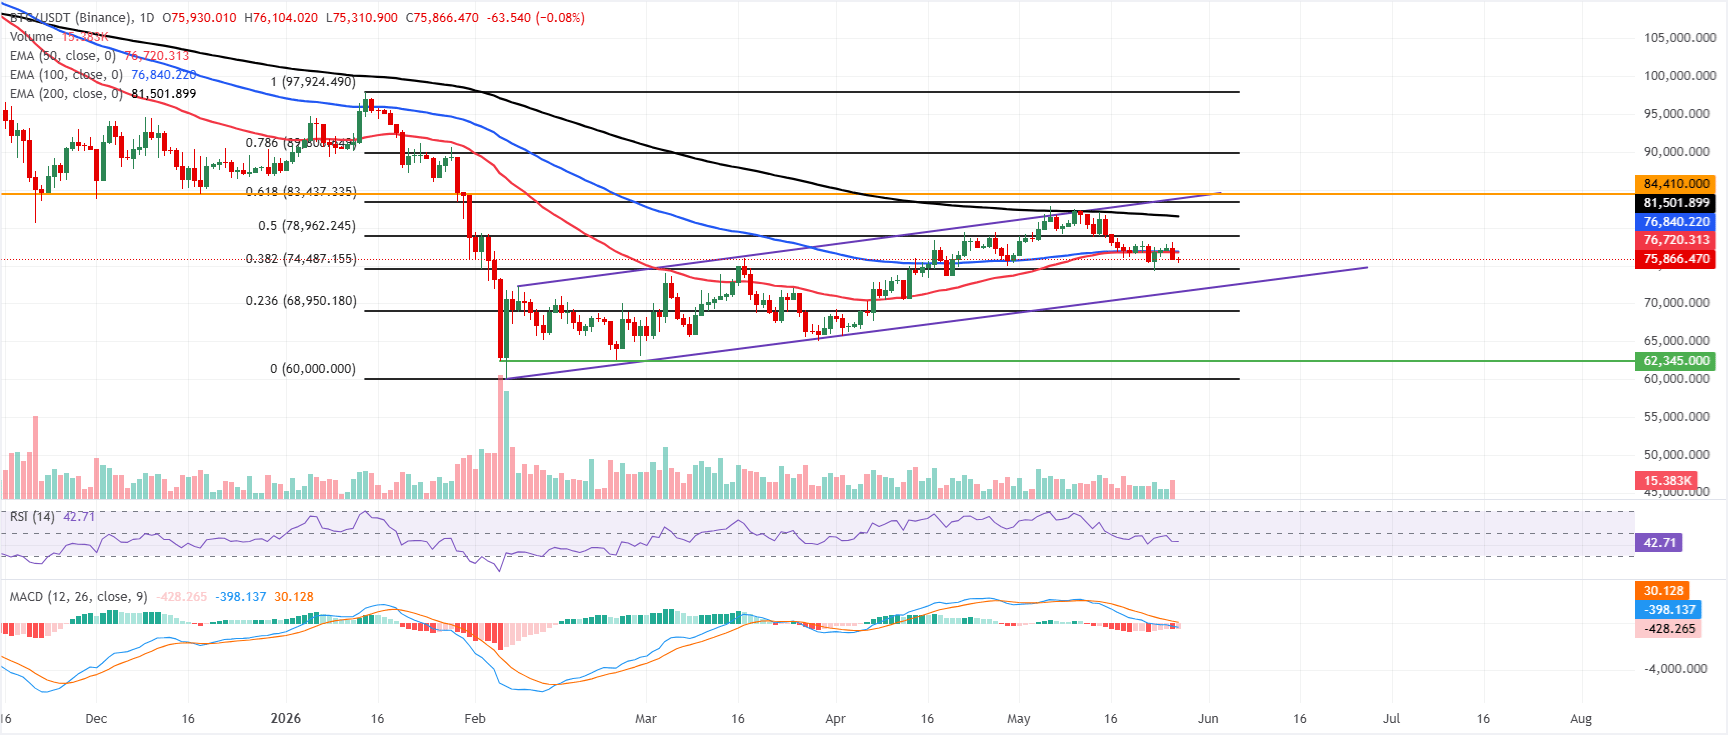
Bitcoin price trades below $76,000 on Wednesday after closing below the key 50-day and 100-day Exponential Moving Averages (EMAs), which were clustered between roughly $76,720 and $76,840 the previous day. BTC maintains a corrective-to-bearish near-term tone as price slips below key EMAs.
The Relative Strength Index (RSI) sits in the low 40s, hinting at soft but not extreme downside momentum, while the Moving Average Convergence Divergence (MACD) histogram remains negative, reinforcing that recent rebounds lack strong follow-through and price stays capped beneath these EMAs.
On the topside, immediate resistance is seen at the 50-day EMA near $76,720, followed by the 100-day EMA at about $76,840, with a stronger barrier at the 50% retracement (drawn from the January high to the February low) around $78,962. Above that, the 200-day EMA at $81,501 and the horizontal level at $84,410 form a higher resistance band.
On the downside, initial support emerges at the 38.2% Fibonacci retracement around $74,487, ahead of an upward trendline support near $71,541, with the 23.6% Fibonacci retracement level around $68,950 expected to act as a deeper structural floor if selling pressure accelerates.
(The technical analysis of this story was written with the help of an AI tool.)
Bitcoin, altcoins, stablecoins FAQs
Bitcoin is the largest cryptocurrency by market capitalization, a virtual currency designed to serve as money. This form of payment cannot be controlled by any one person, group, or entity, which eliminates the need for third-party participation during financial transactions.
Altcoins are any cryptocurrency apart from Bitcoin, but some also regard Ethereum as a non-altcoin because it is from these two cryptocurrencies that forking happens. If this is true, then Litecoin is the first altcoin, forked from the Bitcoin protocol and, therefore, an “improved” version of it.
Stablecoins are cryptocurrencies designed to have a stable price, with their value backed by a reserve of the asset it represents. To achieve this, the value of any one stablecoin is pegged to a commodity or financial instrument, such as the US Dollar (USD), with its supply regulated by an algorithm or demand. The main goal of stablecoins is to provide an on/off-ramp for investors willing to trade and invest in cryptocurrencies. Stablecoins also allow investors to store value since cryptocurrencies, in general, are subject to volatility.
Bitcoin dominance is the ratio of Bitcoin's market capitalization to the total market capitalization of all cryptocurrencies combined. It provides a clear picture of Bitcoin’s interest among investors. A high BTC dominance typically happens before and during a bull run, in which investors resort to investing in relatively stable and high market capitalization cryptocurrency like Bitcoin. A drop in BTC dominance usually means that investors are moving their capital and/or profits to altcoins in a quest for higher returns, which usually triggers an explosion of altcoin rallies.
Bài viết đề xuất


