
Shiba Inu Price Forecast: SHIB stabilizes with bullish momentum building
- Shiba Inu price hovers around $0.0000092 on Tuesday, after finding support around the previous broken trendline.
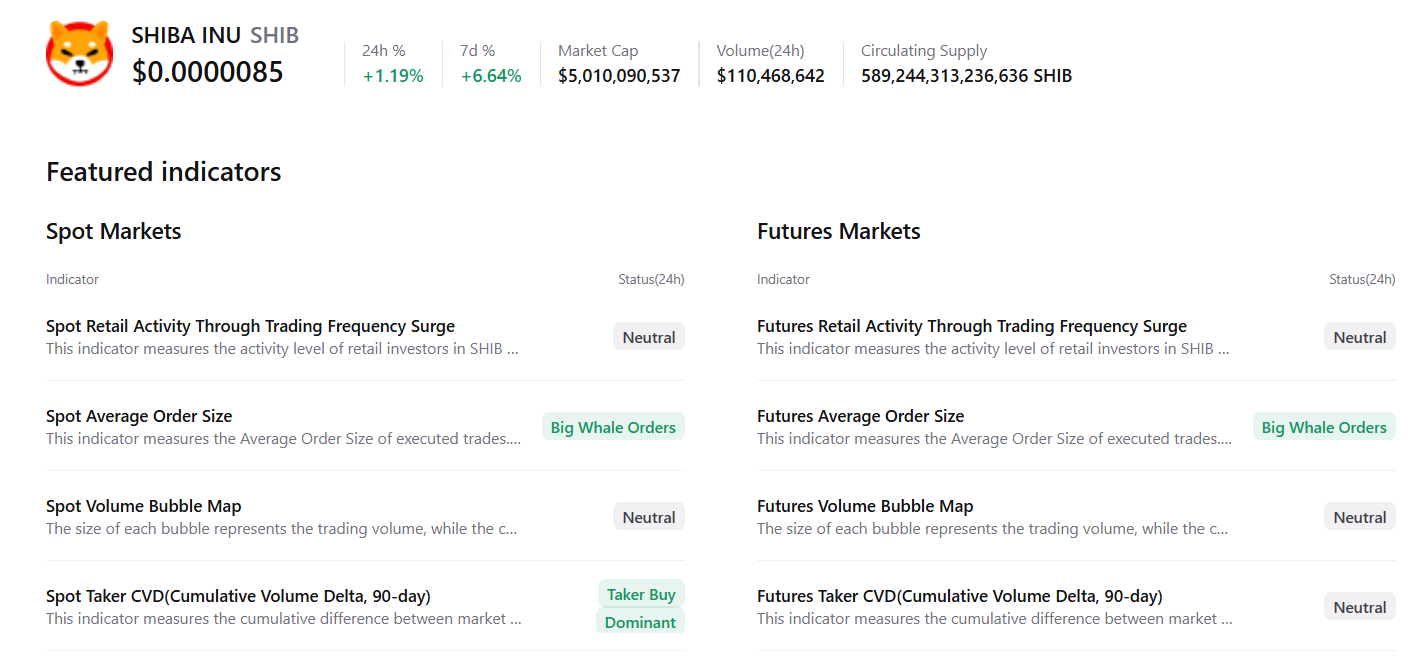
- On-chain and derivatives data support bullish sentiment, with rising trading volume, large whale orders and a positive funding rate.
- The technical outlook suggests a further recovery, with SHIB targeting $0.000010.
Shiba Inu (SHIB) price steadies around $0.0000092 at the time of writing on Tuesday, after rebounding 3% and finding support around the key level. The bullish sentiment is further supported by SHIB’s rising trading volume, large whale orders and buy-side dominance, which have risen alongside positive funding rates. On the technical side, SHIB's price action suggests a further rally, targeting levels above $0.000010.
Shiba’s trading volume hit a 9-month high
Santiment data indicate that the SHIB ecosystem’s trading volume (the aggregate trading volume generated by all exchange applications on the chain) reached $66.91 trillion on Sunday and steadied at $4.01 trillion on Tuesday, the highest level since March 2024. This volume rise indicates a surge in traders’ interest and liquidity in SHIB, boosting its bullish outlook.
 [08-1765251090349-1765251090350.45.25, 09 Dec, 2025].png)
CryptoQuant’s summary data underpins a further positive outlook, as SHIB spot and futures markets show large whale orders and buy dominance. These factors signal a potential rally ahead.
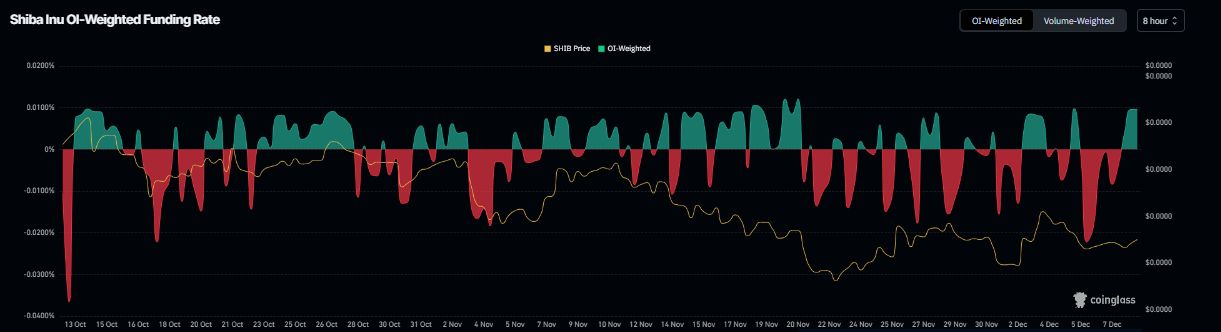
On the derivatives side, Shiba Inu’s funding rate data also support signs of recovery. According to Coinglass’s OI-Weighted Funding Rate data, the number of traders betting that the price of SHIB will slide further is lower than those anticipating a price increase.
The metric has flipped to a positive rate on Monday and stands at 0.0096% on Tuesday, indicating that longs are paying shorts. Historically, as shown in the chart below, when the funding rates have flipped from negative to positive, Shiba Inu’s price has rallied sharply.
Shiba Inu Price Forecast: SHIB finds support around key level
Shiba Inu price broke above the falling wedge pattern (drawn by connecting multiple highs and lows with two trendlines) on December 3. Still, it failed to sustain its upward momentum and was rejected by the 50-day Exponential Moving Average (EMA) at $0.0000092. However, SHIB found support near the upper trendline and rose nearly 3% on Monday. At the time of writing on Tuesday, SHIB hovers at around $0.0000092.
If SHIB continues its upward trend, it could extend the rally toward the next key resistance at $0.000010.
The Relative Strength Index (RSI) on the daily chart is 46, pointing upward toward the neutral 50 level, indicating fading bearish momentum. For the bullish momentum to be sustained, the RSI must move above its neutral level. The Moving Average Convergence Divergence (MACD) showed a bullish crossover last week, which remains intact and supports the bullish view.
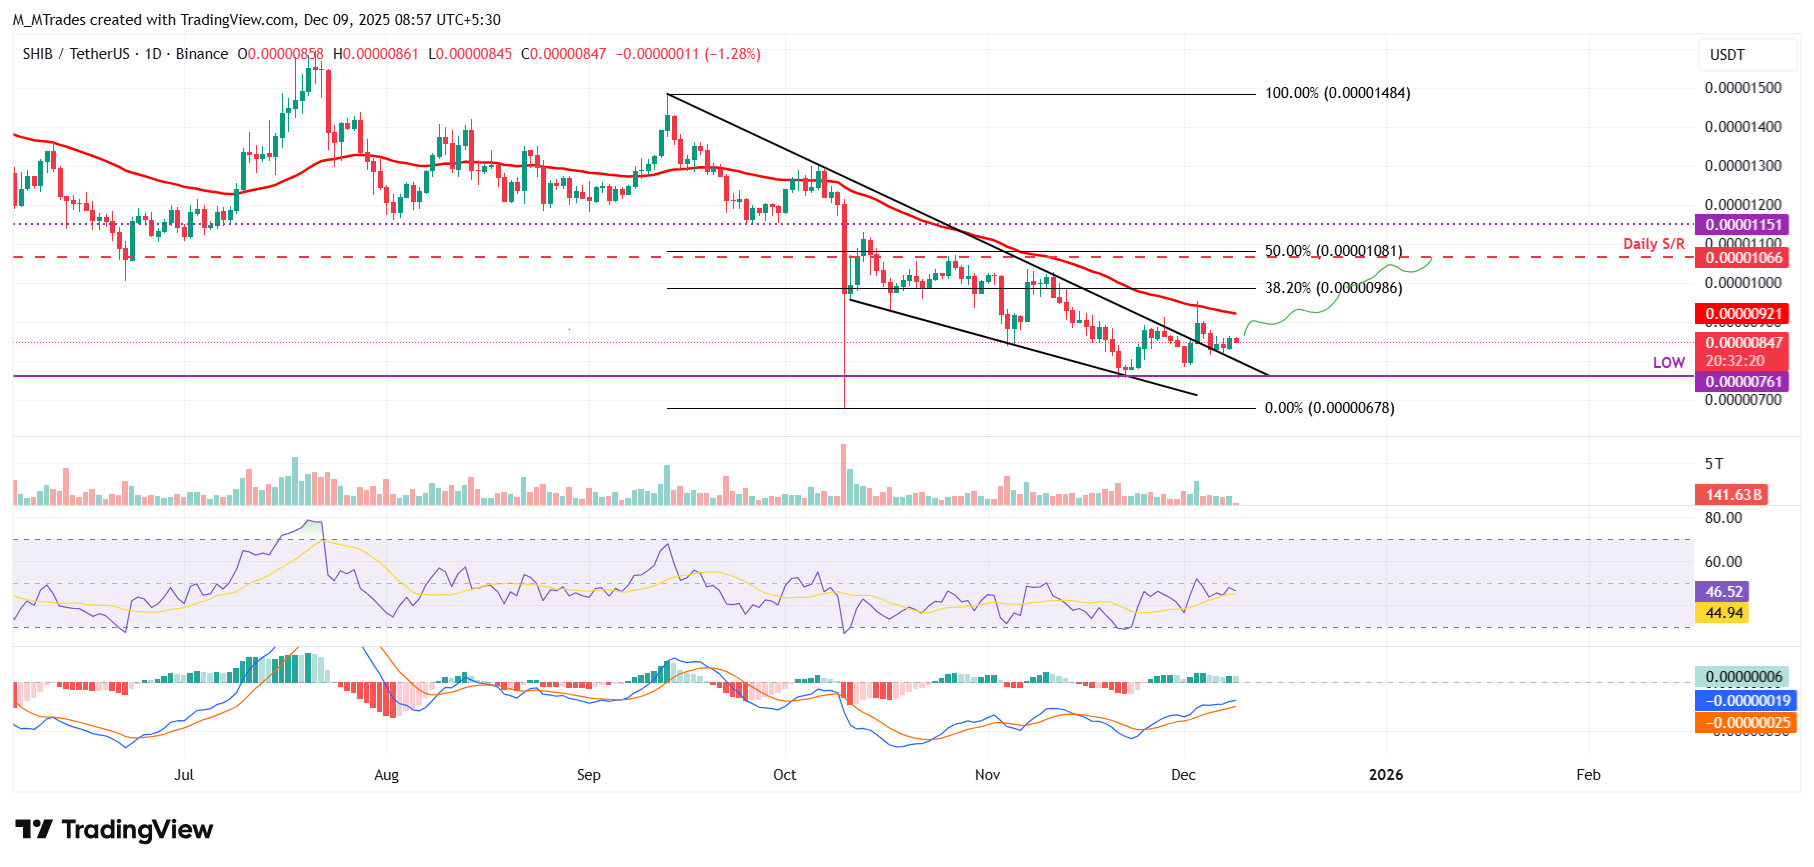
If SHIB faces a correction, it could extend the drop toward the next key support at $0.0000076.
Bài viết đề xuất


