
Bitcoin Price Forecast: Bulls stand off at key support amid persistent bearish pressure
- Bitcoin floats above $87,000 on Tuesday after a 4.51% decline the previous day, testing a crucial demand zone.
- Disappointing US macroeconomic data and signals of a BoJ rate hike in December fueled risk-off in global markets on Monday.
- Fed’s interest rate cut prospects next week could boost demand for Bitcoin amid mild ETF inflows.
Bitcoin (BTC) trades above $87,000 by press time on Tuesday, following a bearish start to December amid a contraction in the US manufacturing sector and the possibility of an interest rate hike by the Bank of Japan (BoJ) at its next monetary policy decision. Altogether could negatively impact Yen-based carry trades.
Still, odds for a rate cut by the US Federal Reserve could increase demand among institutions. Technically, Bitcoin is holding above a crucial demand zone between $80,600 and $84,73, which could absorb the incoming supply pressure.
Weak US PMI data and Japan’s rate hike plans put pressure on Bitcoin
The US ISM Manufacturing Purchasing Managers' Index (PMI) figure released on Monday– based on the business activity of manufacturing companies – stood at 48.2 in November, down from 48.7 in October, missing expectations of 48.6. PMI data below 50 suggests a contraction in the sector, which could signal increased pressure on companies following the US tariff hike.
On a more hawkish note, the Bank of Japan is considering raising its interest rate on December 19, which would raise the cost of borrowing Yen, negatively impacting Yen-based carry trades – as seen on Monday in the global financial market. If this leads to a sell-off wave in traditional financial markets, it could strengthen demand for Gold, while Bitcoin might suffer due to its growing correlation with the US stock market.
Risk-off sentiment rises in Bitcoin derivatives
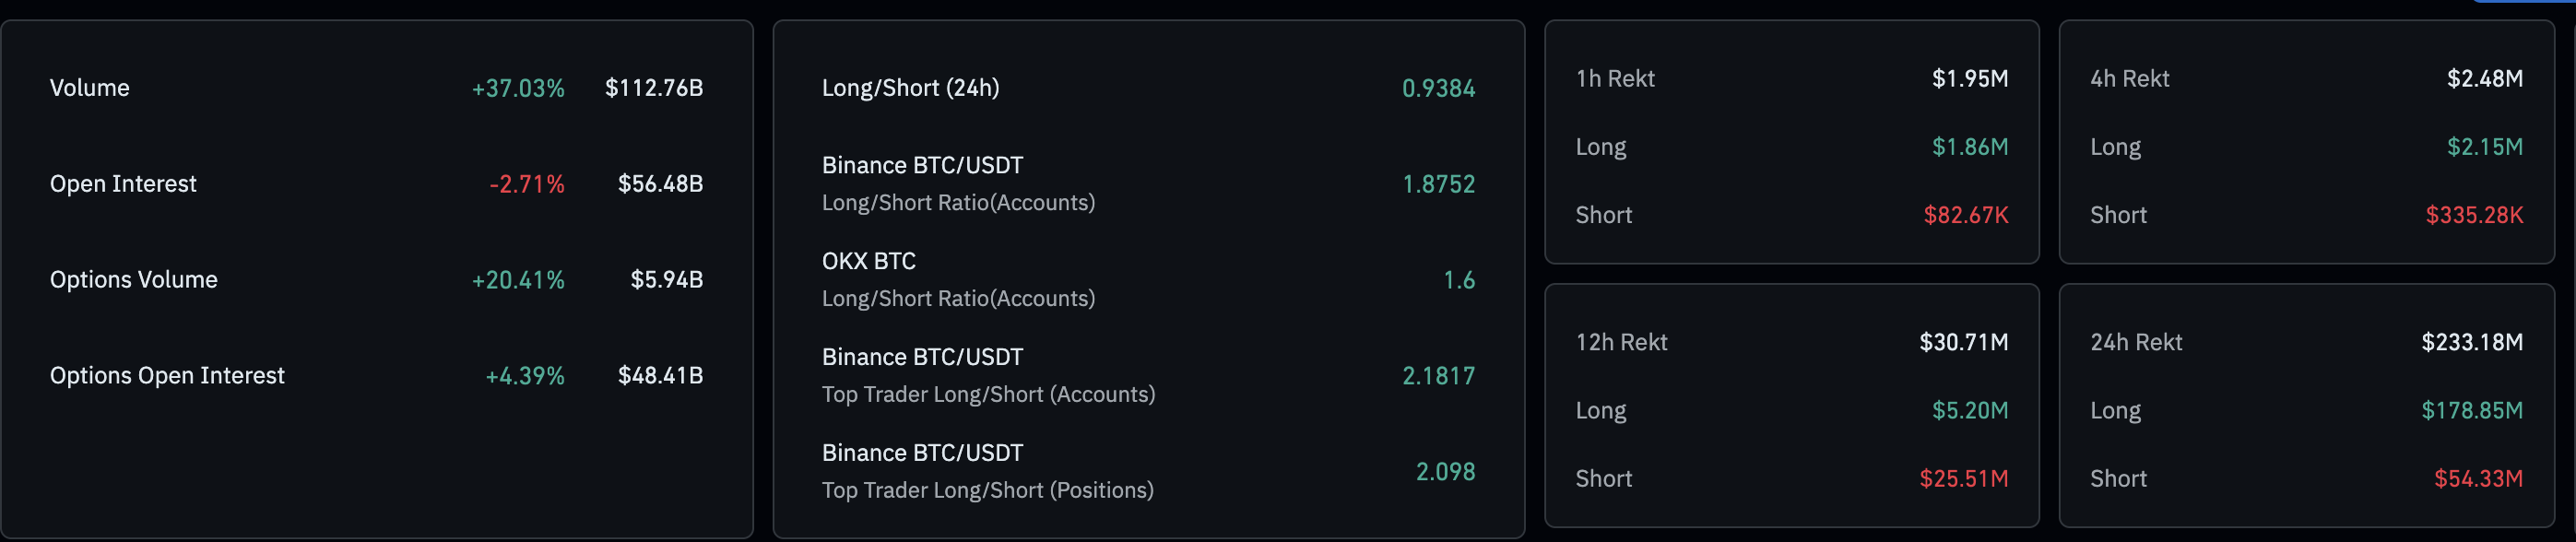
Amid macroeconomic headwinds, the derivatives market is experiencing a lack of investor confidence. CoinGlass data shows that BTC futures Open Interest (OI) dropped 2.17% over the last 24 hours to $56.48 billion, indicating that traders are reducing their capital at risk as expectations of a bounce back fade.
Additionally, long liquidations of $178.85 million outpace short liquidations of $54.33 million in the last 24 hours, indicating a larger wipeout of bullish-aligned positions.
Is a bounce back possible in Bitcoin?
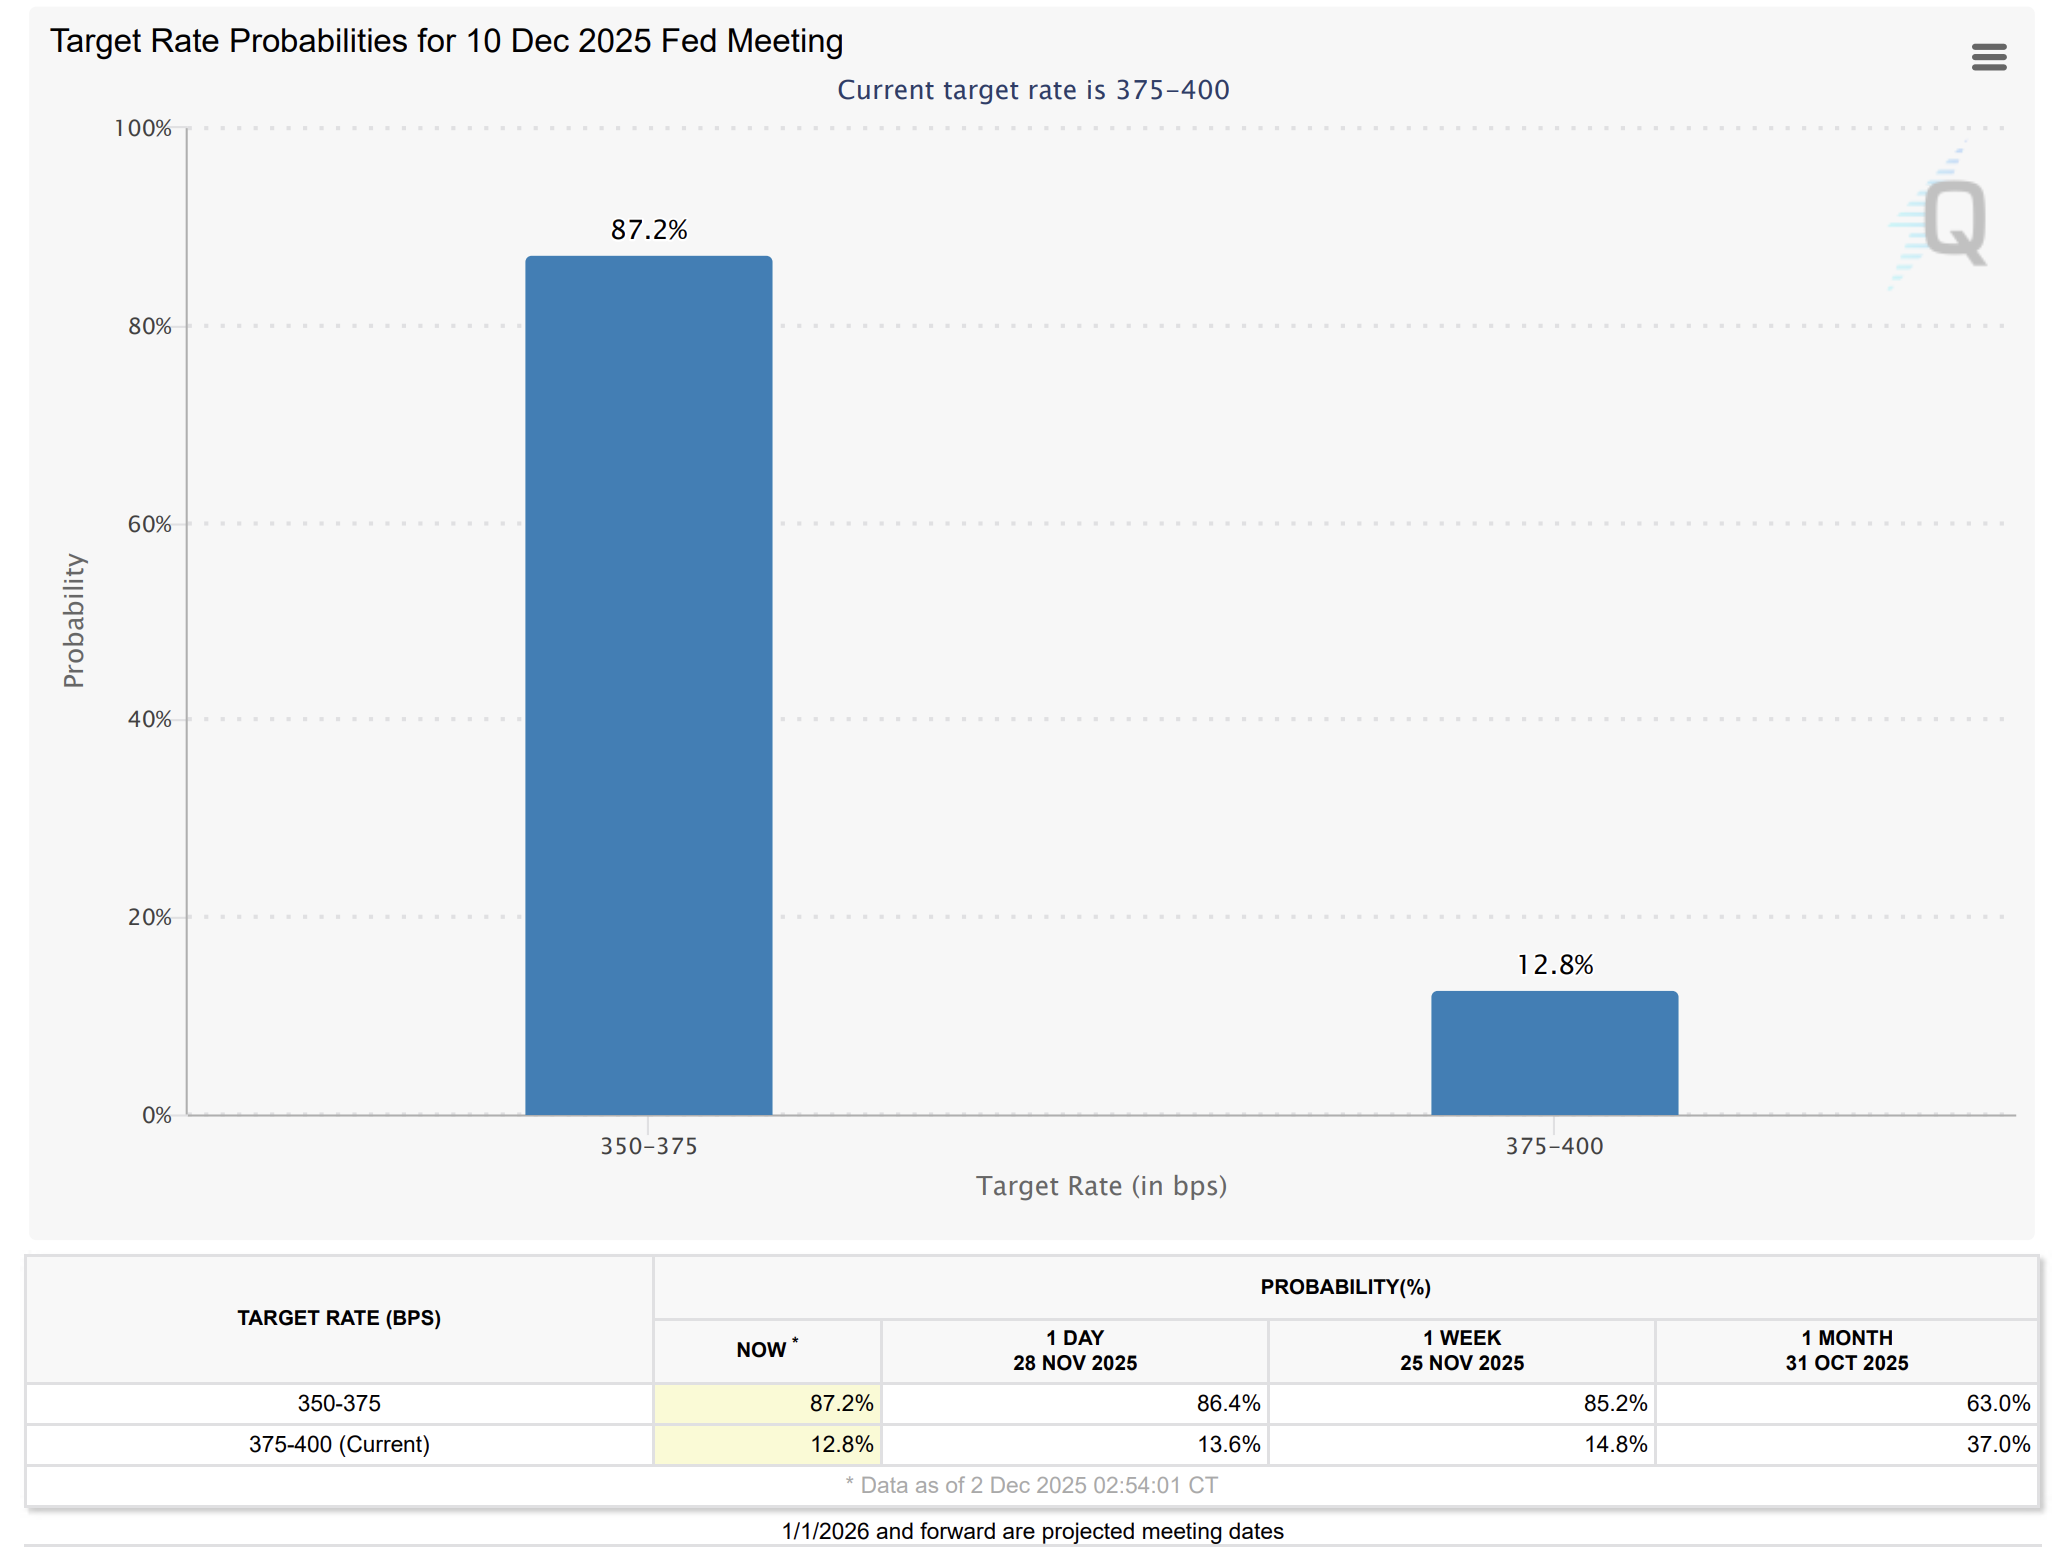
Despite the US November ISM Manufacturing PMI data released on Monday missing expectations, the CME Group's FedWatch Tool showed an 87% chance of the Fed cutting rates by 25 basis points to 3.50%-3.75% at the December 9-10 meeting. Typically, a rate cut allows investors to increase their risk tolerance as the cost of borrowing capital reduces.
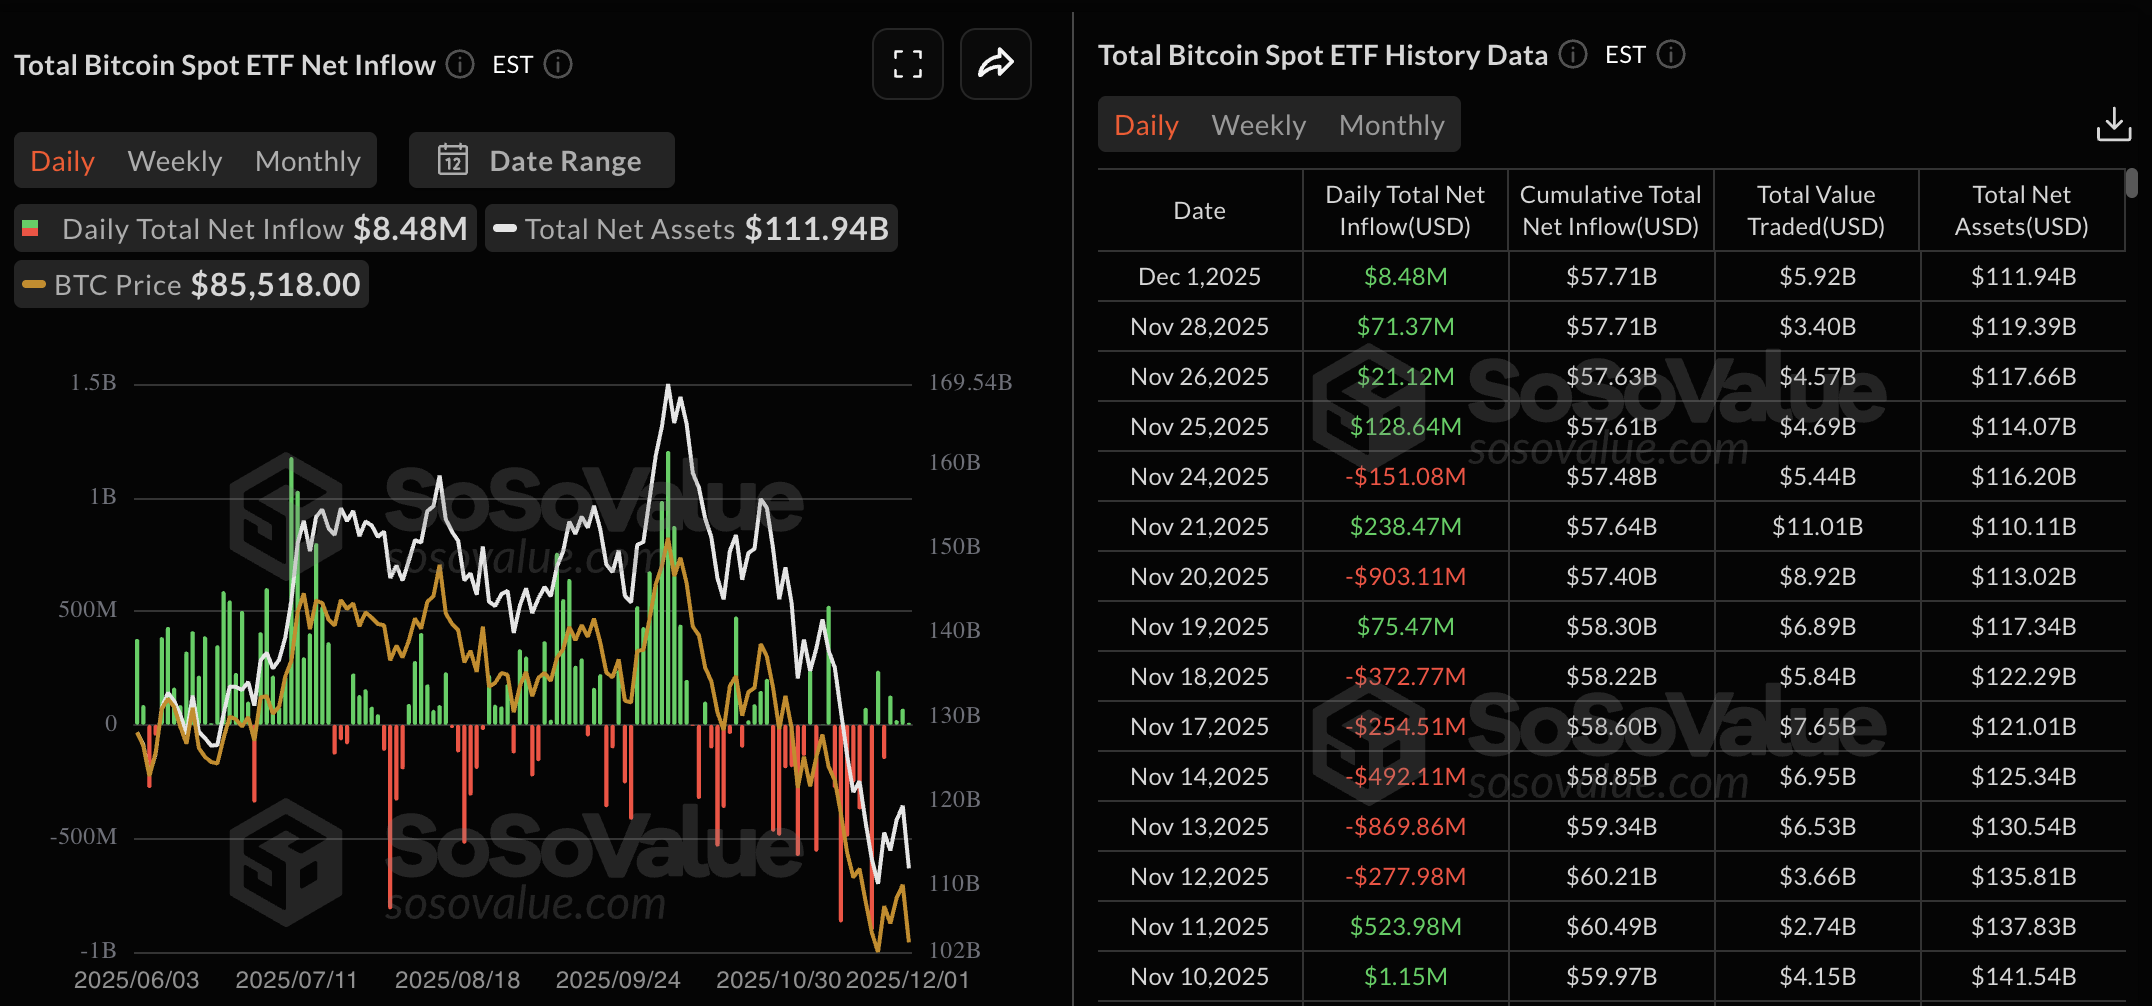
In such a case, US Bitcoin spot Exchange Traded Funds (ETFs) could experience large inflows, potentially fueling overall market sentiment. As of Monday, the US BTC spot ETFs held $111.94 billion in Total Net Assets, following four consecutive days of inflows.
Technical outlook: Bitcoin signals a potential bottom formation
Bitcoin has recovered 1% so far on Tuesday after a bearish Marubozu formed the previous day. Still, the rebound from $83,822 on Monday pushed the daily close above $86,000, reflecting strong demand between the November 22 close at $84,739 and the November 21 low at $80,600.
However, if Bitcoin decisively closes below $80,600, it could test the April low at $74,508.
The Relative Strength Index (RSI) is at 35 on the daily chart, struggling to stay afloat above the oversold zone and indicating intense overhead selling pressure. At the same time, the Moving Average Convergence Divergence (MACD) loses its upward momentum and shifts towards the signal line. If the average lines crossover, it would indicate a bearish shift in trend momentum and flash a sell signal.
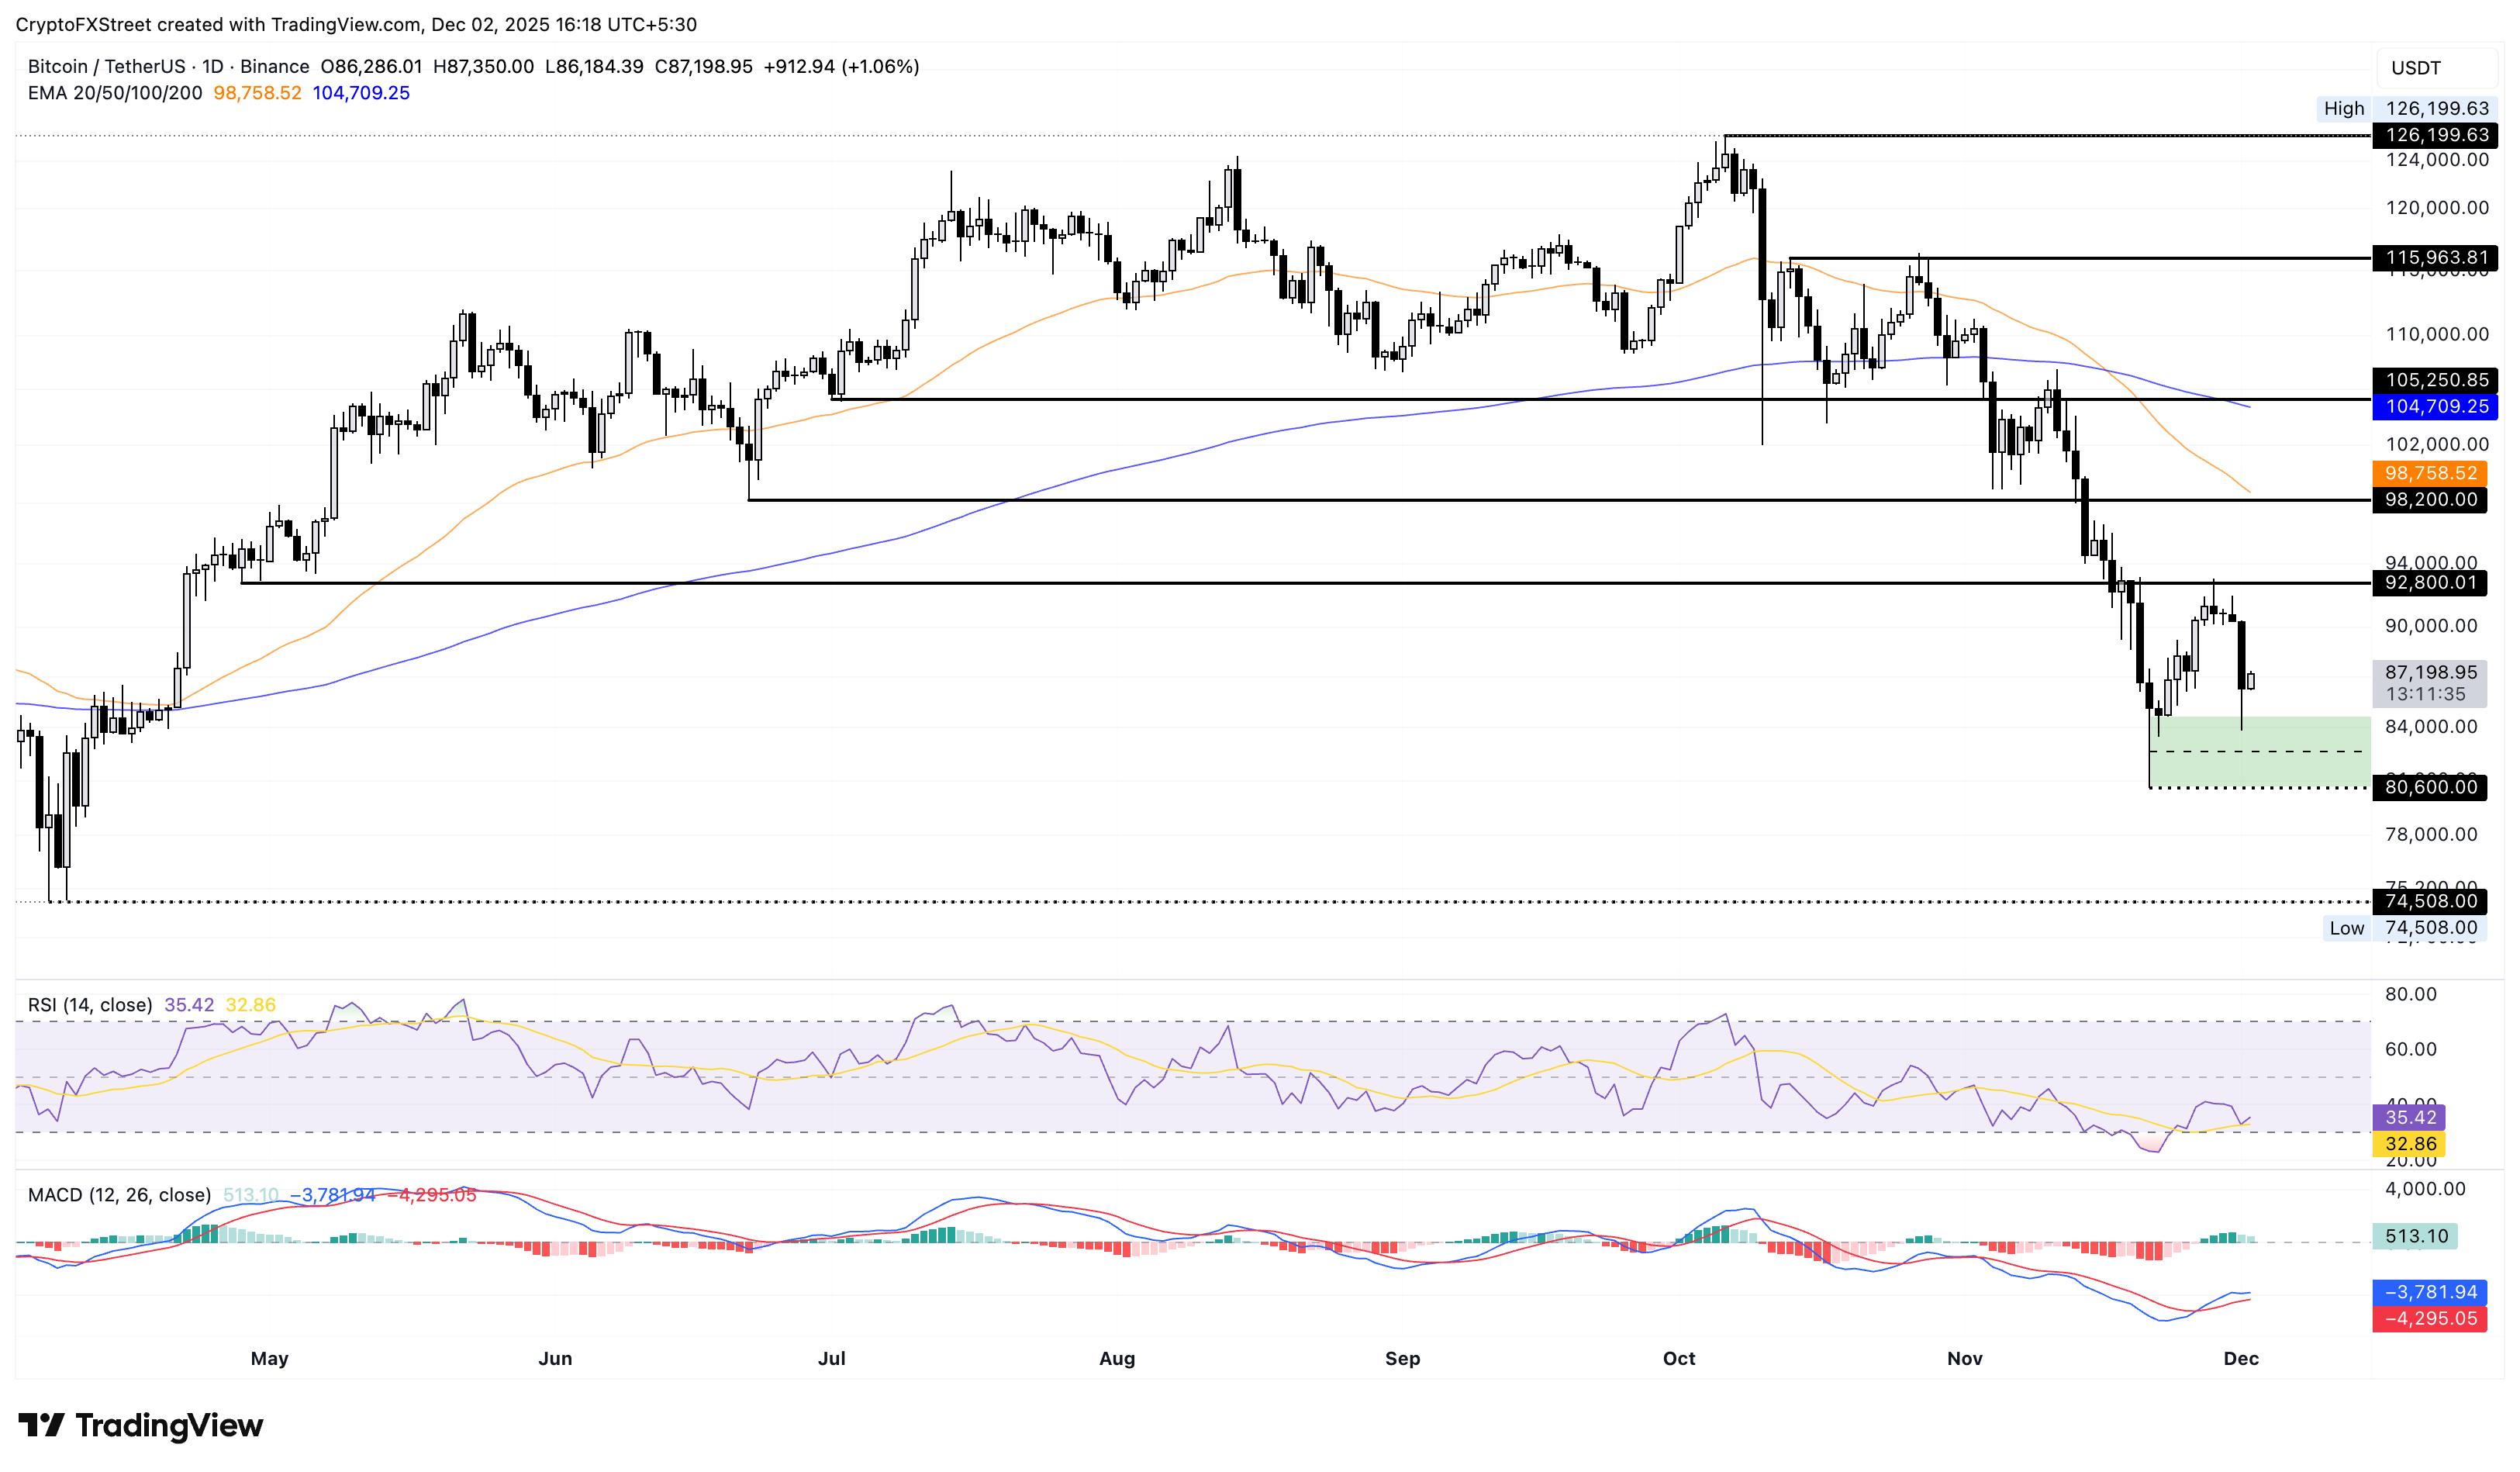
To reinstate an upward trend, Bitcoin should resurface above the $92,800 level, which capped prices last week, avoiding a decisive close above it. If BTC bulls reclaim this level, the breakout rally could target $98,200, marked by the June 22 low.
Bitcoin, altcoins, stablecoins FAQs
Bitcoin is the largest cryptocurrency by market capitalization, a virtual currency designed to serve as money. This form of payment cannot be controlled by any one person, group, or entity, which eliminates the need for third-party participation during financial transactions.
Altcoins are any cryptocurrency apart from Bitcoin, but some also regard Ethereum as a non-altcoin because it is from these two cryptocurrencies that forking happens. If this is true, then Litecoin is the first altcoin, forked from the Bitcoin protocol and, therefore, an “improved” version of it.
Stablecoins are cryptocurrencies designed to have a stable price, with their value backed by a reserve of the asset it represents. To achieve this, the value of any one stablecoin is pegged to a commodity or financial instrument, such as the US Dollar (USD), with its supply regulated by an algorithm or demand. The main goal of stablecoins is to provide an on/off-ramp for investors willing to trade and invest in cryptocurrencies. Stablecoins also allow investors to store value since cryptocurrencies, in general, are subject to volatility.
Bitcoin dominance is the ratio of Bitcoin's market capitalization to the total market capitalization of all cryptocurrencies combined. It provides a clear picture of Bitcoin’s interest among investors. A high BTC dominance typically happens before and during a bull run, in which investors resort to investing in relatively stable and high market capitalization cryptocurrency like Bitcoin. A drop in BTC dominance usually means that investors are moving their capital and/or profits to altcoins in a quest for higher returns, which usually triggers an explosion of altcoin rallies.
Bài viết đề xuất


