
Pi Network rebounds after four-day decline, mixed technicals signal caution
- Pi Network ticks higher by over 2% on Tuesday after four consecutive days of losses.
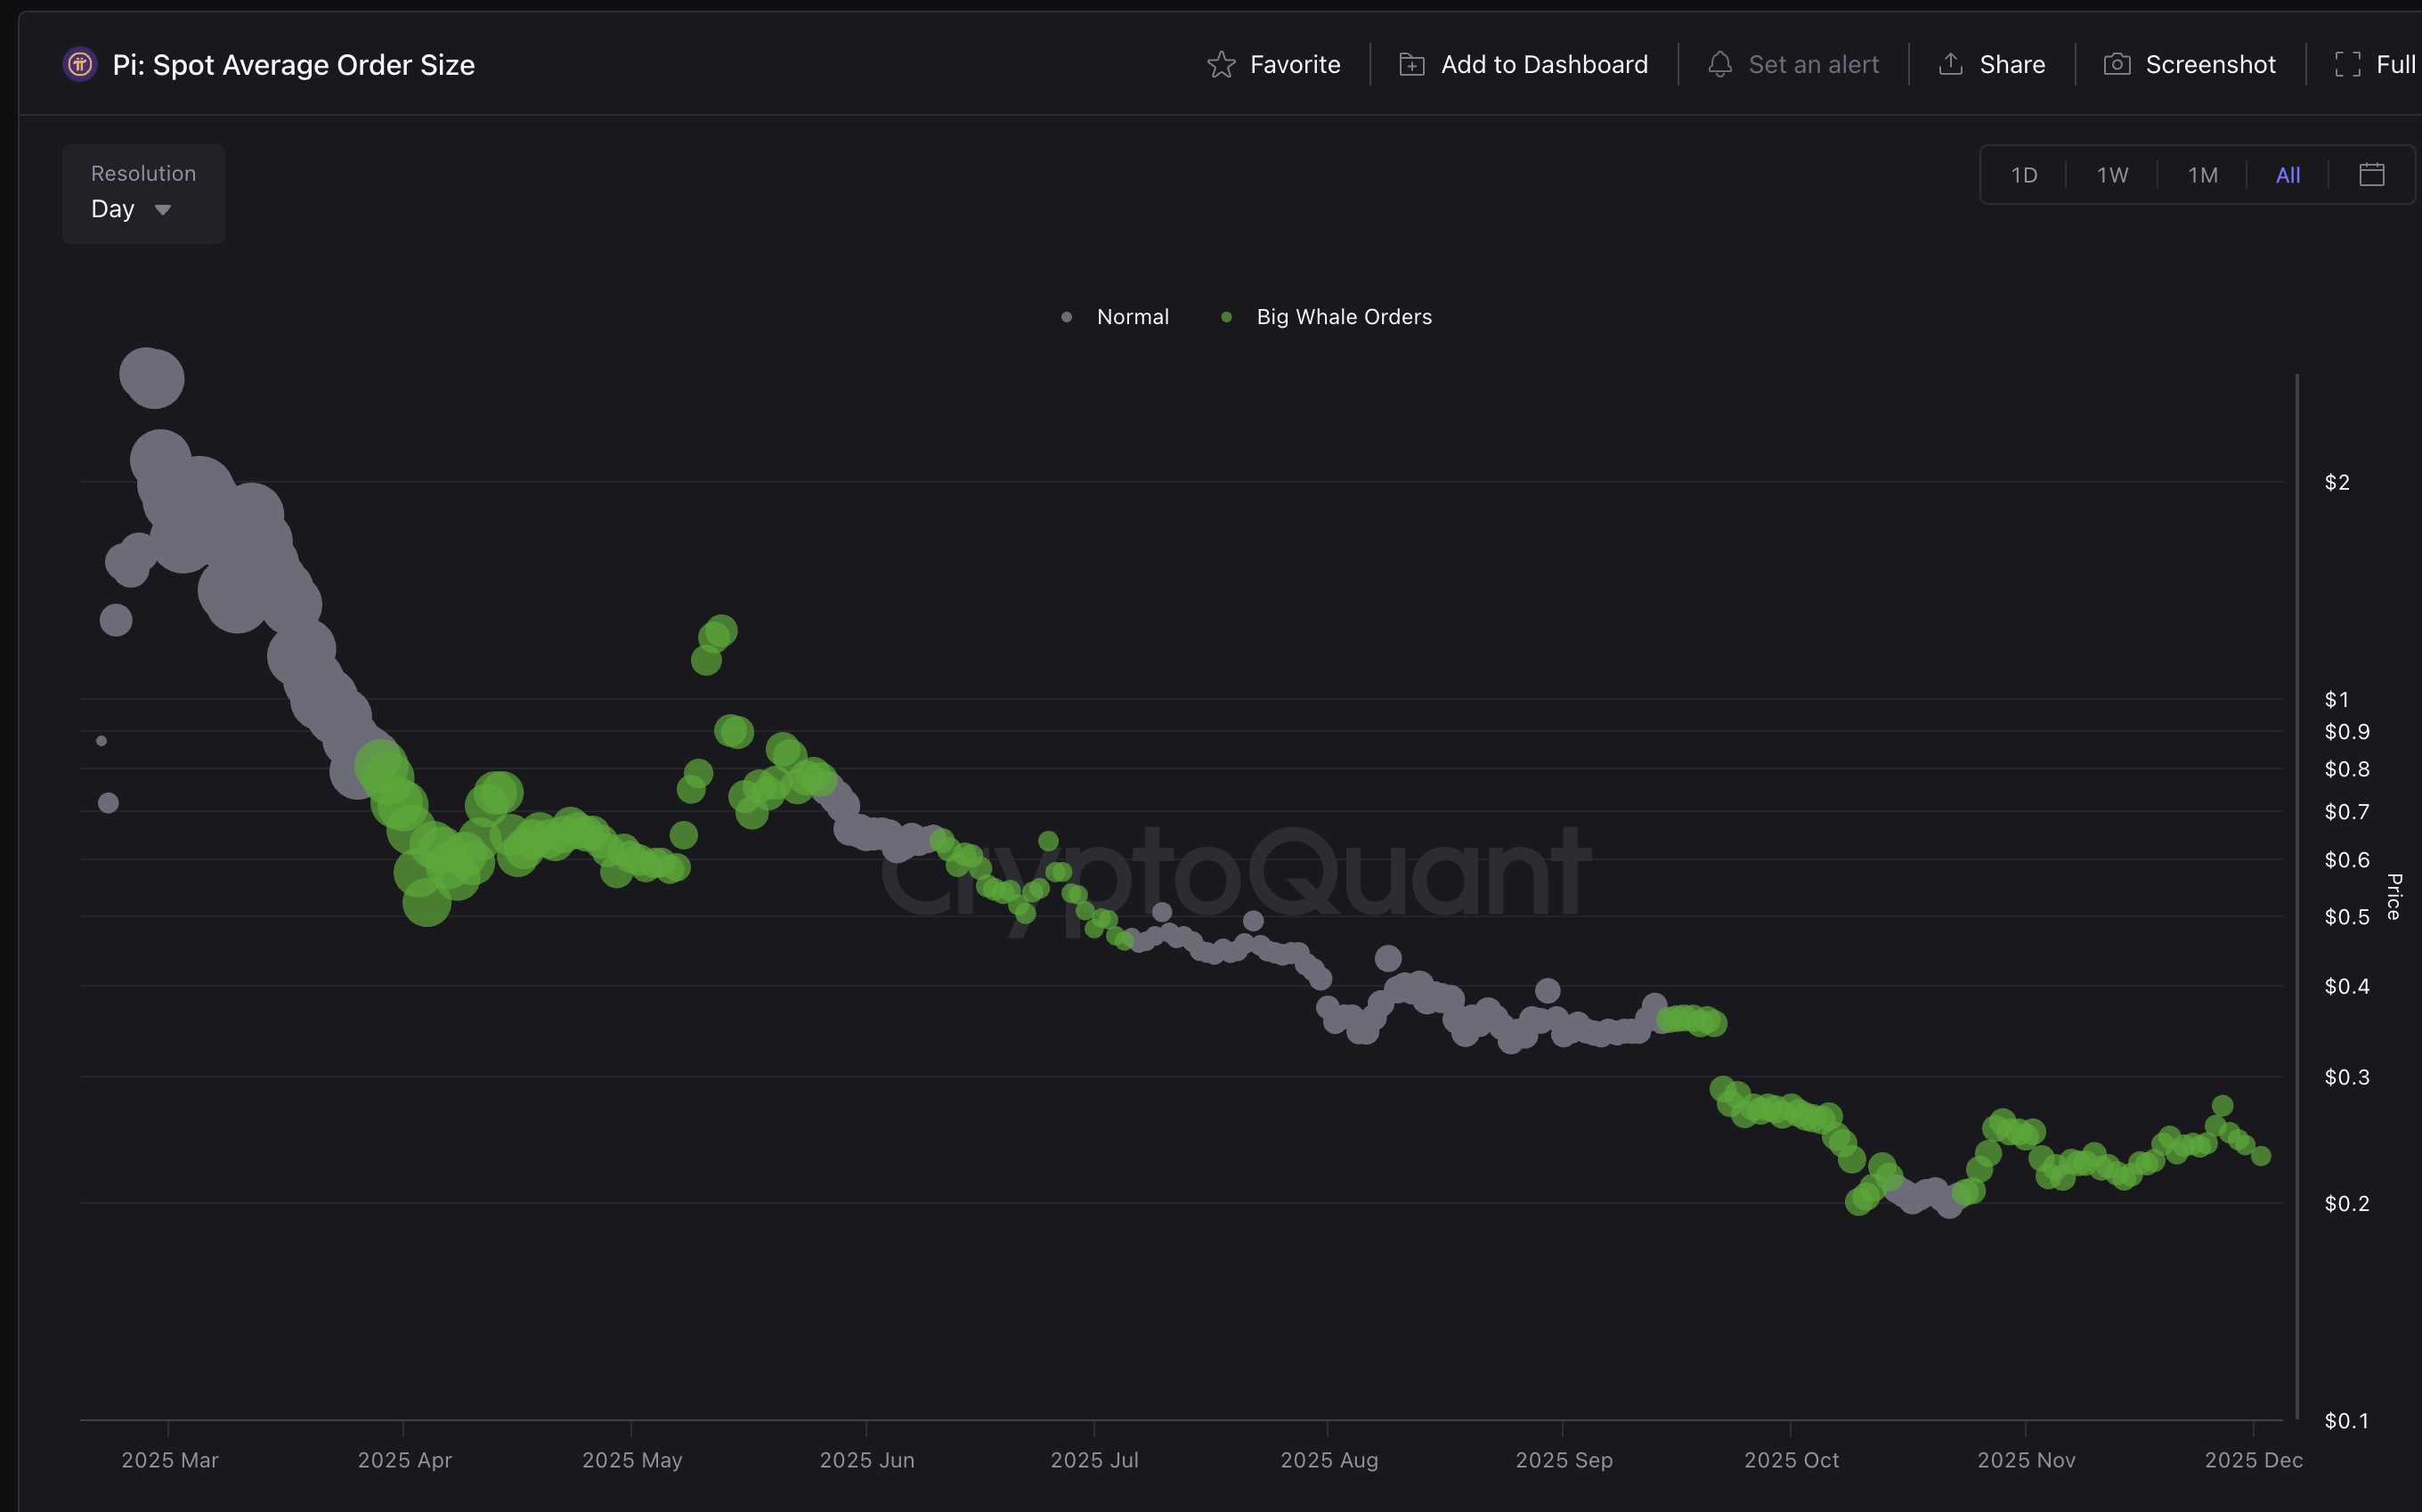
- A surge in large-wallet investors' interest in Pi Network’s spot market signals upside potential.
- The technical outlook for PI remains mixed, as the MACD indicator flashes a sell signal while the RSI hovers near the midline.
Pi Network (PI) ticks higher by 2% at press time on Tuesday, after a steady decline over four consecutive days, marking a downcycle within a larger consolidation range. However, a persistent demand from large-wallet investors, popularly known as whales, flags the range as a potential accumulation zone, suggesting an upside breakout.
Although the whales remain interested, the technical outlook for PI remains mixed, with momentum indicators flashing neutral to bearish signals.
Persistent whale interest signals potential recovery
A steady interest from whales in a cryptocurrency during the consolidation phase is typically associated with an accumulation zone, which could foreshadow a recovery run. CryptoQuant’s data shows an increase in whale activity in the PI spot market, boosting the average order size.
Historically, a similar accumulation phase in April led to the sharp recovery seen in early May.
Technical outlook: Will Pi Network’s recovery break out of the consolidation range?
Pi Network trades below the 50-day Exponential Moving Average (EMA) at press time on Tuesday. The PI token’s intraday recovery triggers an abrupt end to its bearish trend from the $0.2860 upper resistance of a consolidation range, with the lower support at $0.1919, marked by the September 23 high and October 11 low, respectively.
A decisive close above $0.2860 would confirm a bullish breakout of the consolidation range. On the upside, the PI token could face resistance at $0.3220 and $0.3987, corresponding to the low of August 1 and the high of August 30, respectively.
However, the momentum indicators on the daily chart signal underlying weakness in the trend, as the Moving Average Convergence Divergence (MACD) crossed below its red line on Monday, signaling a bearish shift and a sell signal.
Still, the Relative Strength Index (RSI) is at 47, rising toward the halfway line after a steep correction during the four-day correction period, fluctuating near the neutral levels.
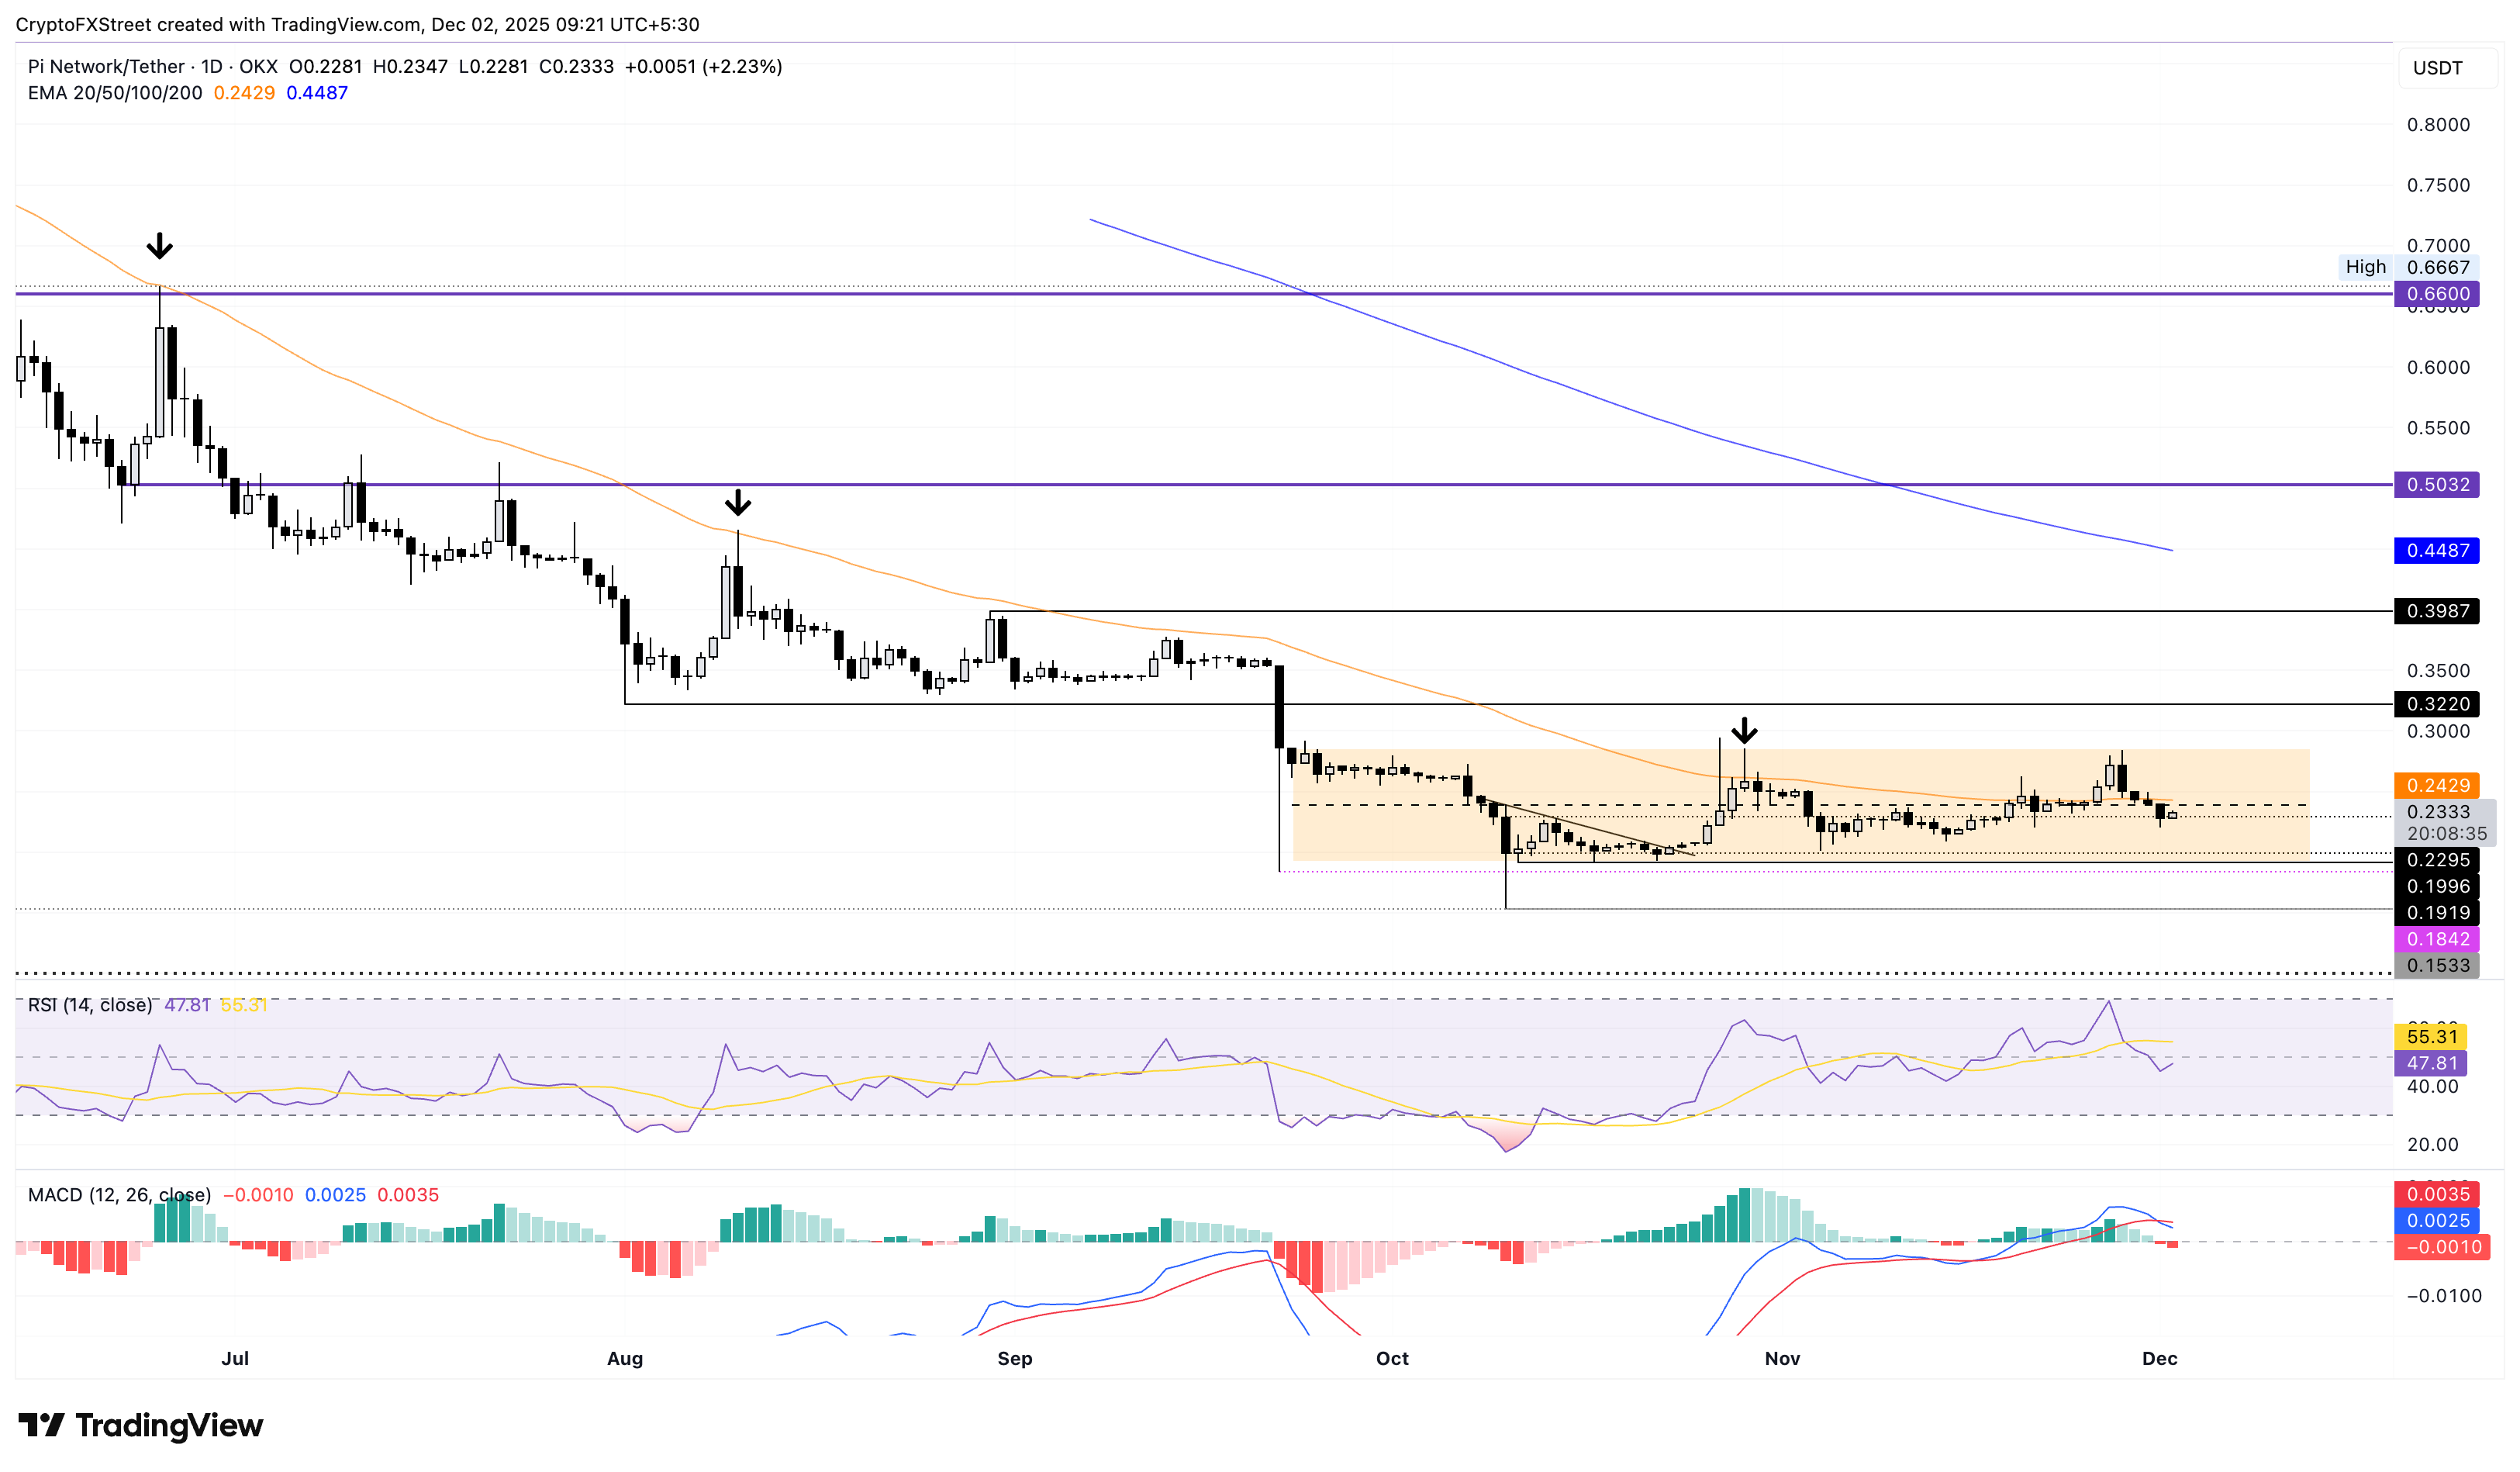
On the downside, key support for PI remains at the $0.2000 psychological level and the October 11 low at $0.1919.
Bitcoin, altcoins, stablecoins FAQs
Bitcoin is the largest cryptocurrency by market capitalization, a virtual currency designed to serve as money. This form of payment cannot be controlled by any one person, group, or entity, which eliminates the need for third-party participation during financial transactions.
Altcoins are any cryptocurrency apart from Bitcoin, but some also regard Ethereum as a non-altcoin because it is from these two cryptocurrencies that forking happens. If this is true, then Litecoin is the first altcoin, forked from the Bitcoin protocol and, therefore, an “improved” version of it.
Stablecoins are cryptocurrencies designed to have a stable price, with their value backed by a reserve of the asset it represents. To achieve this, the value of any one stablecoin is pegged to a commodity or financial instrument, such as the US Dollar (USD), with its supply regulated by an algorithm or demand. The main goal of stablecoins is to provide an on/off-ramp for investors willing to trade and invest in cryptocurrencies. Stablecoins also allow investors to store value since cryptocurrencies, in general, are subject to volatility.
Bitcoin dominance is the ratio of Bitcoin's market capitalization to the total market capitalization of all cryptocurrencies combined. It provides a clear picture of Bitcoin’s interest among investors. A high BTC dominance typically happens before and during a bull run, in which investors resort to investing in relatively stable and high market capitalization cryptocurrency like Bitcoin. A drop in BTC dominance usually means that investors are moving their capital and/or profits to altcoins in a quest for higher returns, which usually triggers an explosion of altcoin rallies.
Bài viết đề xuất


