Solana Price Forecast: SOL tumbles to five-month low as ETF inflows and sentiment weaken

Nguồn Fxstreet
  • Solana trades below $150 after a 5% drop on Thursday, marking its lowest daily close in the last five months.
  • Institutional demand wanes as US spot Solana ETFs record the lowest daily inflow ever.
  • Retail demand wavers as Open Interest and funding rates signal a bearish shift in sentiment.

Solana (SOL) marks the third consecutive week of losses, dropping over 13% so far this week. The two-week-old Solana spot Exchange Traded Funds (ETFs) in the US have recorded the lowest net inflows ever, suggesting softer institutional demand. Furthermore, the derivatives market sentiment suffers with the broader market correction, resulting in reduced risk exposure to Solana. 

The technical outlook for Solana remains grim as Solana bears aim for the $125 low from June. 

Demand wavers for Solana as market volatility spikes

Solana loses ground and investors’ confidence as the broader cryptocurrency market suffers from Bitcoin’s (BTC) slip below $100,000. Sosovalue data shows that the US Solana spot ETFs logged $1.49 million net inflow on Thursday, mainly driven by the Bitwise Solana staking ETF. This marks the lowest inflow since the inception of Solana ETFs, reflecting reduced demand from institutional investors and limiting risk exposure as market conditions fluctuate. 
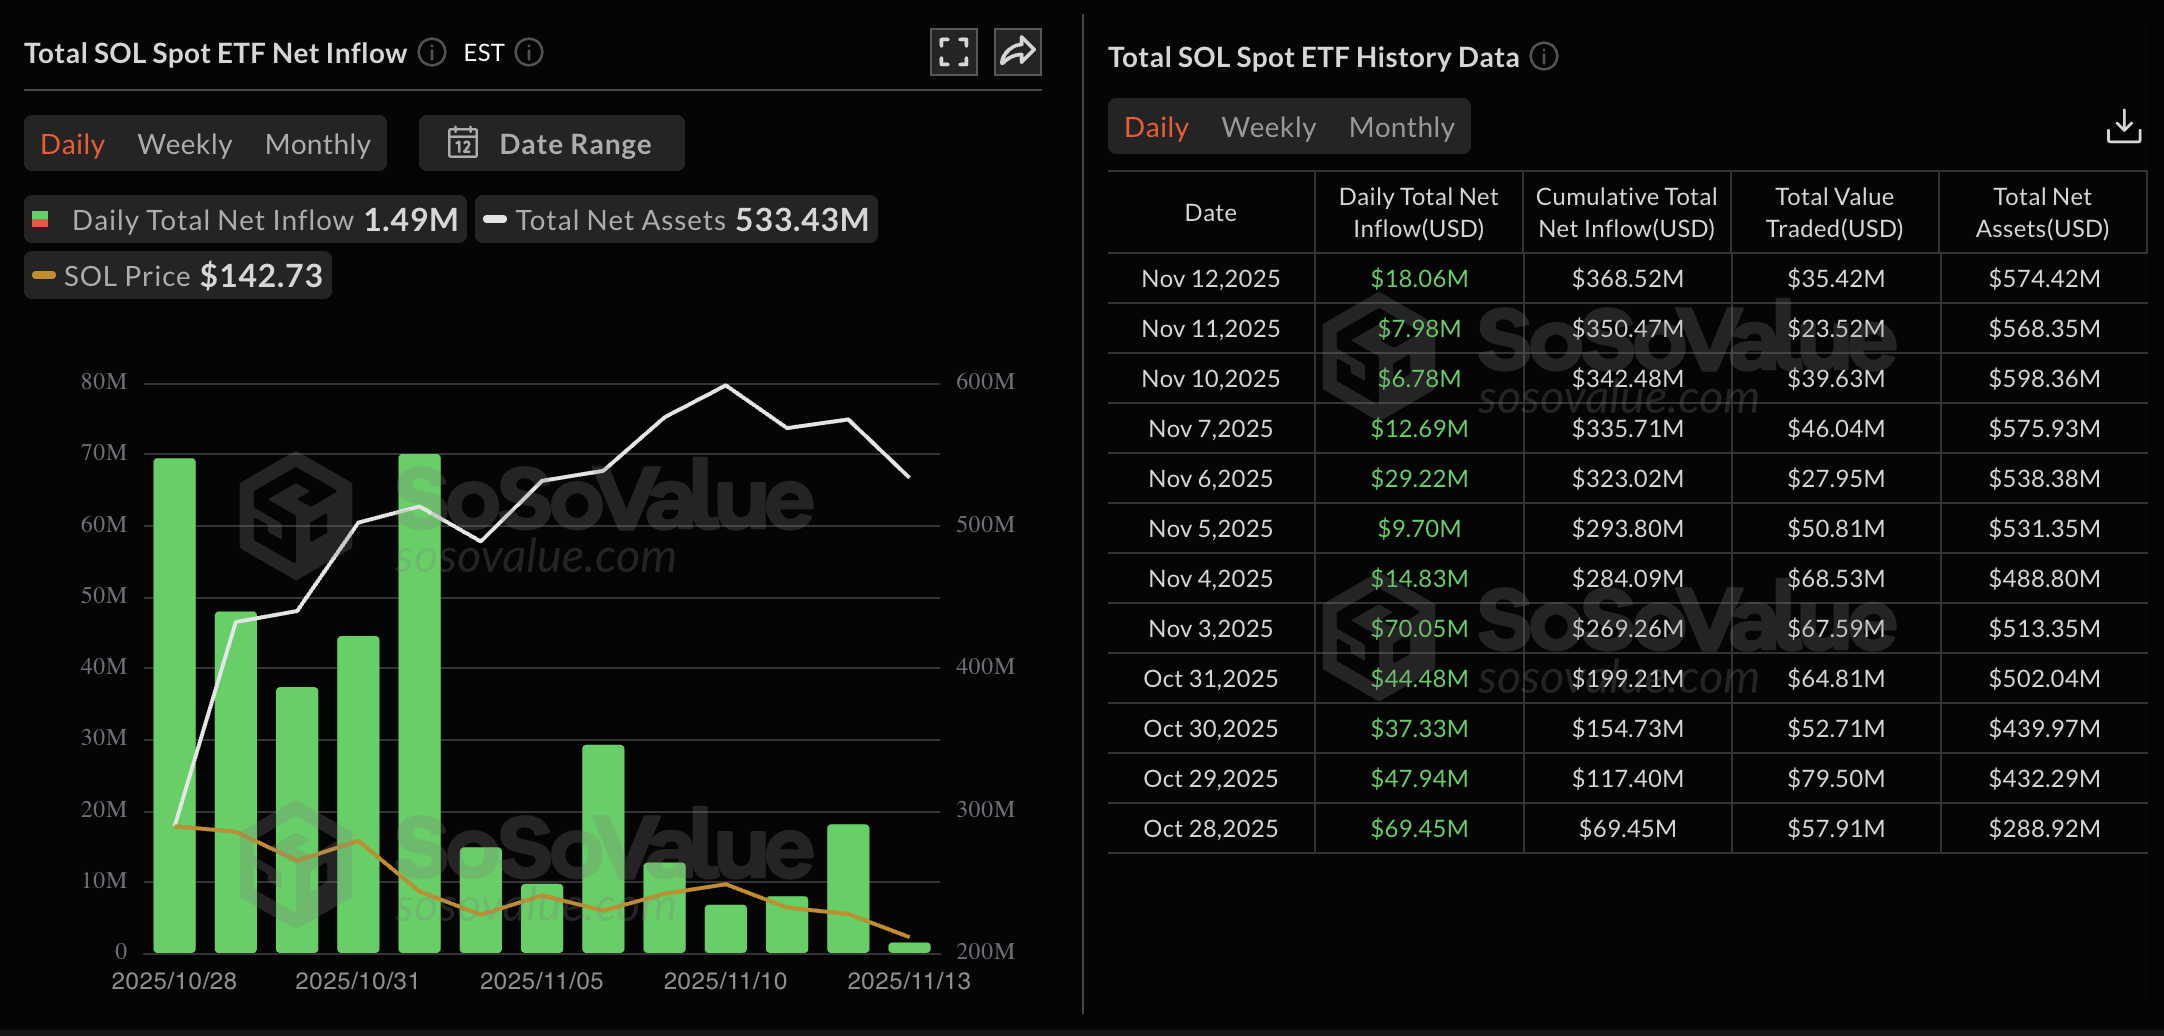
Solana ETFs data. Source: Sosovalue.

A similar trend is visible in the derivatives market as sentiment shifts bearish, with traders reducing capital allocated to Solana futures. CoinGlass data shows that the SOL futures Open Interest (OI) – notional value of outstanding SOL futures contracts – is down 3.34% in the last 24 hours to $7.35 billion. This indicates that traders are either closing long positions or reducing leverage. 

Corroborating the bearish shift, the OI-weighted funding rate has shifted to a negative level of -0.0076% from near-neutral levels earlier in the day, indicating that traders are willing to hold short positions and anticipate an extended correction. 
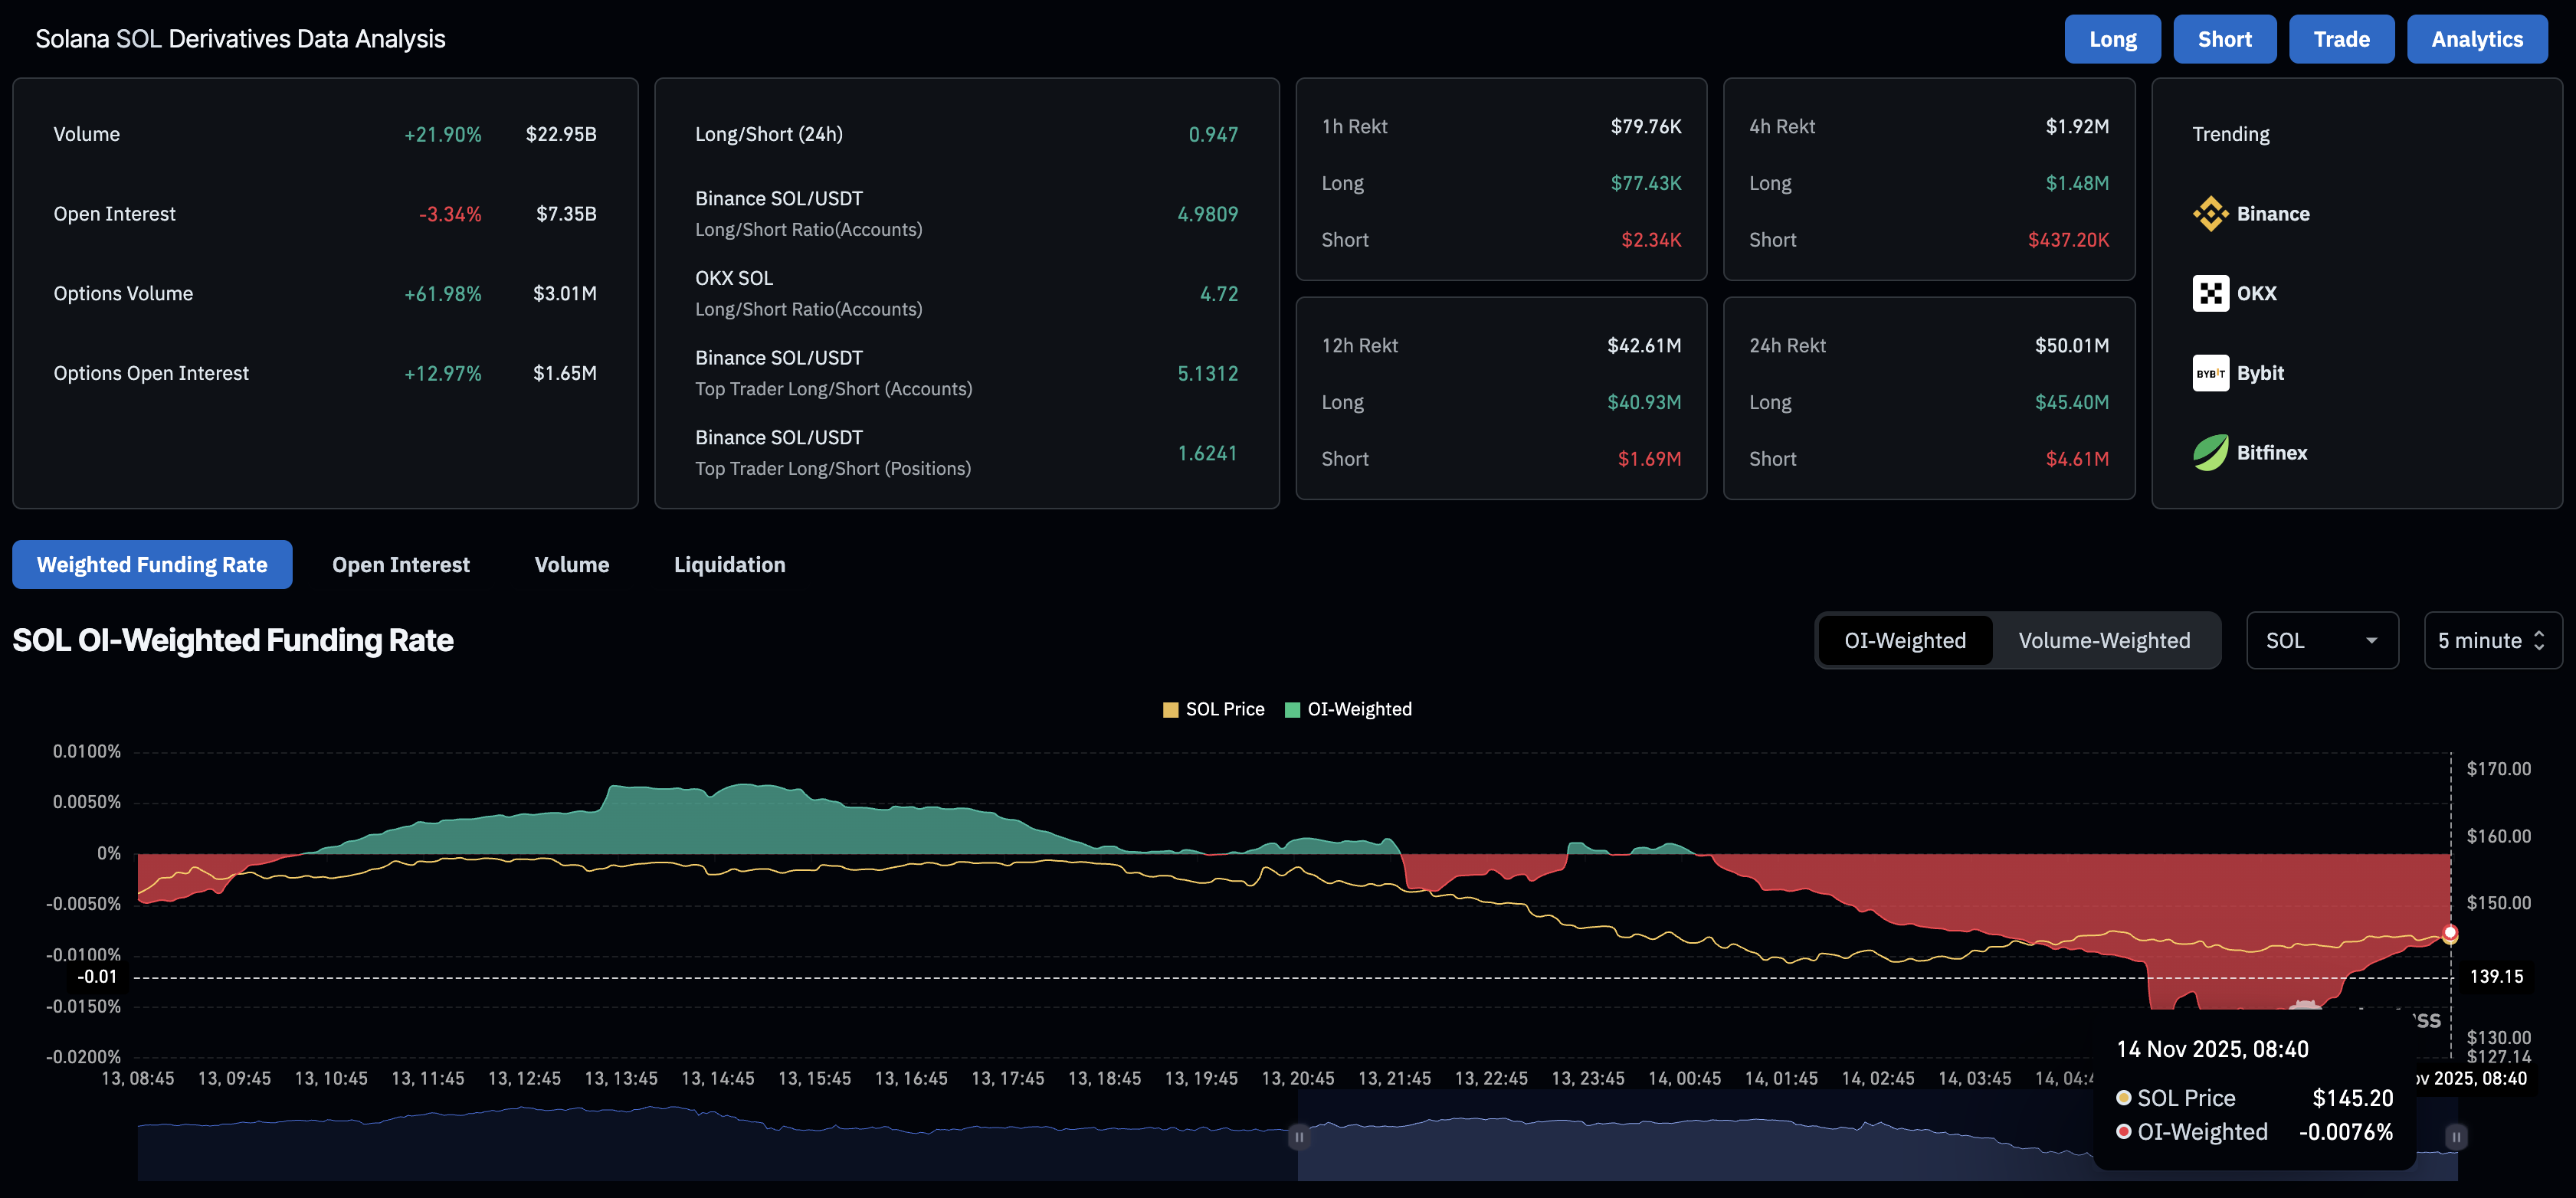
SOL derivatives data. Source: CoinGlass.

If Solana derivatives continue to bleed capital or ETFs record their first net daily outflow, the recovery would be a tough battle for bulls. 

Technical outlook: Will Solana extend the decline to $100?

Solana edges lower for the fourth consecutive day this week, breaking below the $150 psychological level. At the time of writing, SOL is down nearly 2% so far on Friday, aiming for the $126 low from June 22. If SOL breaks below $126, it could test the $100 psychological support, followed by the $95 low from April 7. 

The short-term dominance of bearish candles fuels the declining trend in the 50-day Exponential Moving Average (EMA), which converges with the 200-day EMA, risking a Death Cross pattern. If the pattern materializes, it could flash a sell signal, cementing that the short-term bearish trend has outpaced the longer-term trend. 

Meanwhile, the trend momentum shifts bearish on the daily timeframe as the Moving Average Convergence Divergence (MACD) fails to cross above the signal line, extending the downward trend.

At the same time, the Relative Strength Index (RSI) dips to 31 on the same chart, oscillating towards the oversold zone, which reflects a fresh surge in selling pressure. However, as RSI hovers on the oversold boundary while SOL price makes a fresh low, this generates a bullish RSI divergence pattern signaling a potential bounce back. 
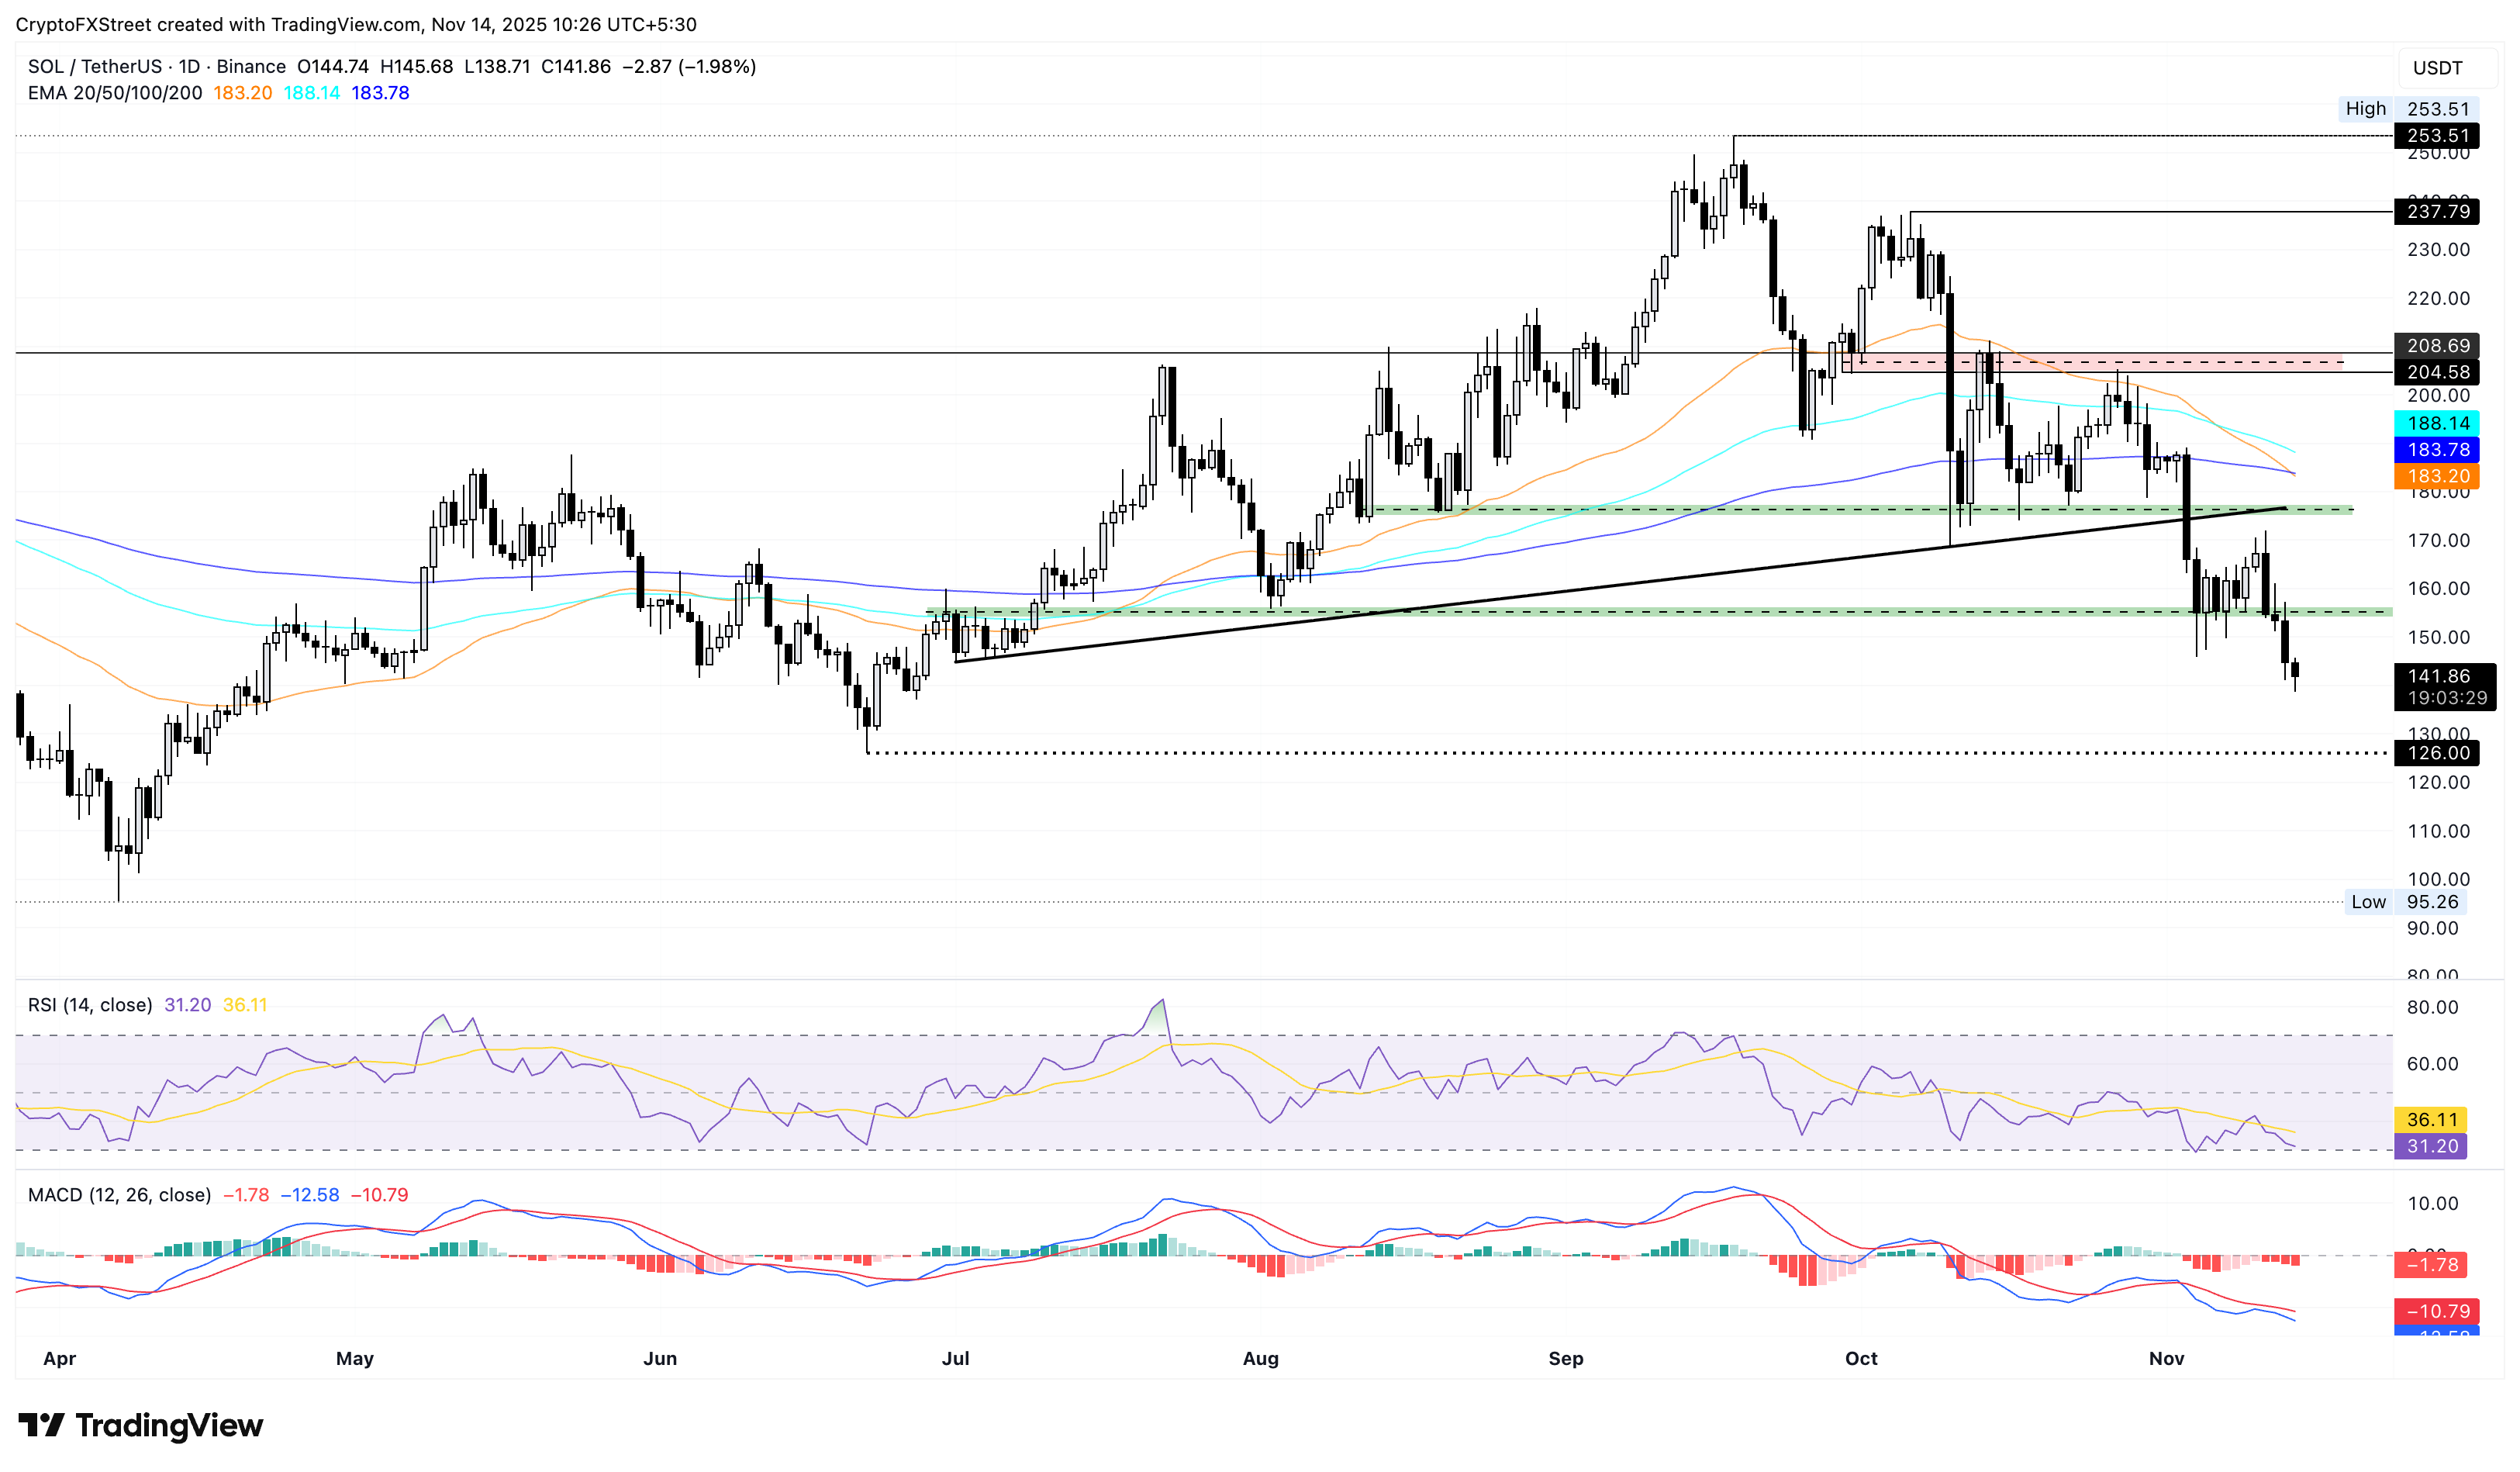
SOL/USDT daily price chart.

If SOL resurfaces above the $155 demand-turned-supply zone, it could approach the $175 resistance. 

Tuyên bố miễn trừ trách nhiệm: Chỉ dành cho mục đích thông tin. Hiệu suất trong quá khứ không đảm bảo cho kết quả trong tương lai.
placeholder
Nhìn lại lịch sử giá vàng trong 50 năm qua. Liệu vàng còn tiếp tục thời kỳ hoàng kim thêm 50 năm nữa? Trong 50 năm qua, vàng vẫn luôn giữ được vị thế là tài sản được ưa chuộng và phổ biến nhất thế giới. Giao dịch vàng luôn được các nhà đầu tư quan tâm do mức độ thanh khoản cao và tầm ảnh hưởng lớn đến toàn bộ thị trường tài chính. Vậy, lịch sử giá vàng như thế nào và cách đầu tư vàng ra sao? Chúng ta sẽ cùng tìm hiểu qua bài viết dưới đây.
Tác giả  Nhóm Traderins
ngày11 tháng 12 năm 2023
Trong 50 năm qua, vàng vẫn luôn giữ được vị thế là tài sản được ưa chuộng và phổ biến nhất thế giới. Giao dịch vàng luôn được các nhà đầu tư quan tâm do mức độ thanh khoản cao và tầm ảnh hưởng lớn đến toàn bộ thị trường tài chính. Vậy, lịch sử giá vàng như thế nào và cách đầu tư vàng ra sao? Chúng ta sẽ cùng tìm hiểu qua bài viết dưới đây.
placeholder
Đợt tăng 400% trong tháng 10 của Zcash cho thấy dấu hiệu đuối sức — liệu sắp có nhịp điều chỉnh?Zcash (ZEC) gây chú ý với mức tăng gần 400% trong tháng 10 và nhảy 44.2% trong tuần này. Chỉ riêng 24 giờ qua còn tăng thêm 6.6%, cho thấy lực mua rất mạnh. Tuy nhiên, dù giá Zcash tiếp tục leo dốc, c
Tác giả  BeInCrypto
10 tháng 31 ngày Thứ Sáu
Zcash (ZEC) gây chú ý với mức tăng gần 400% trong tháng 10 và nhảy 44.2% trong tuần này. Chỉ riêng 24 giờ qua còn tăng thêm 6.6%, cho thấy lực mua rất mạnh. Tuy nhiên, dù giá Zcash tiếp tục leo dốc, c
placeholder
3 altcoin có thể đạt mức cao nhất mọi thời đại trong tuần đầu tiên của tháng 11Thị trường crypto đã kết thúc tháng 10 trong xu hướng giảm giá, tuy nhiên khi tháng mới bắt đầu, kỳ vọng về mức giá cao mới đang gia tăng trong giới đầu tư.BeInCrypto đã phân tích ba altcoin có khả nă
Tác giả  BeInCrypto
11 tháng 04 ngày Thứ Ba
Thị trường crypto đã kết thúc tháng 10 trong xu hướng giảm giá, tuy nhiên khi tháng mới bắt đầu, kỳ vọng về mức giá cao mới đang gia tăng trong giới đầu tư.BeInCrypto đã phân tích ba altcoin có khả nă
placeholder
Khoản hỗ trợ thuế quan 2,000 USD của Trump có ảnh hưởng đến thị trường tiền điện tử?Kế hoạch của chính quyền Trump phát hành các khoản thanh toán “dividend” được tài trợ từ thuế quan đã kích hoạt cuộc tranh luận trên các thị trường tài chính, bao gồm cả tiền điện tử.Nhà Trắng cho biế
Tác giả  BeInCrypto
Hôm qua 03: 01
Kế hoạch của chính quyền Trump phát hành các khoản thanh toán “dividend” được tài trợ từ thuế quan đã kích hoạt cuộc tranh luận trên các thị trường tài chính, bao gồm cả tiền điện tử.Nhà Trắng cho biế
placeholder
WTI tăng lên gần 60,00$ do rủi ro về nguồn cung do các lệnh trừng phạt của MỹGiá dầu West Texas Intermediate (WTI) tăng trong phiên giao dịch thứ hai liên tiếp, giao dịch quanh mức 59,90$, tăng hơn 2%, trong giờ giao dịch châu Á vào thứ Sáu. Giá dầu thô nhận được hỗ trợ từ những rủi ro về nguồn cung liên quan đến các lệnh trừng phạt sắp tới của Hoa Kỳ (Mỹ)
Tác giả  FXStreet
3 giờ trước
Giá dầu West Texas Intermediate (WTI) tăng trong phiên giao dịch thứ hai liên tiếp, giao dịch quanh mức 59,90$, tăng hơn 2%, trong giờ giao dịch châu Á vào thứ Sáu. Giá dầu thô nhận được hỗ trợ từ những rủi ro về nguồn cung liên quan đến các lệnh trừng phạt sắp tới của Hoa Kỳ (Mỹ)
sản phẩm liên quan
goTop
quote